Dividend Discount Model
A valuation method used to estimate the intrinsic value of a stock by projecting its future dividend payments and discounting them back to present value


What Is The Dividend Discount Model (DDM)?
The Dividend Discount Model, the DDM, is a valuation model to estimate a company's stock price based on the assumption that the stock's intrinsic value is worth the sum of all its future dividends discounted back to its present value.

Moreover, there is no risk to the money we have right now.
Future Value = Present Value *(1 + interest rate)number of periods
Present Value = Future Value / (1+ interest rate)number of periods
Thus, money's value is dependent on time.
The model discounts future dividends to their present value at a lower amount. Dividend projections involve risk because they could or might not be paid in the future.
The discount rate discounts the possibility that they won't be paid for any reason to compute the dividends' net present value. This is done by using the time value of money idea to evaluate.

Depending on the investment risk, the discount rate differs from business to business.
For instance, we don't need to discount as much for a dividend aristocrat as we would for a growing company because the latter may start increasing investments in the company rather than paying out earnings as dividends to shareholders.
- The Dividend Discount Model (DDM) estimates a company's stock price based on the present value of all future dividends.
- DDM uses the time value of money concept to discount future dividends to their present value.
- There are various types of DDM, each based on different assumptions about dividend growth.
- DDM has advantages like simplicity, clarity, and ease of understanding.
- DDM's shortcomings include reliance on future predictions and assumptions about constant dividends.
DDM Variations
There are various DDMs based on different assumptions about the growth of dividends, such as: zero growth, constant growth, variable growth, two-stage, and three-stage.
The more complex the assumption is, the more realistic the model will be.Thus, the three-stage dividend discount model is the most practical but is also difficult to calculate from a mathematical perspective.
These adaptations make the DDM more versatile and applicable to a wide array of companies with different growth trajectories and dividend policies. Each model's effectiveness, however, is highly dependent on the precision of the input data and the appropriateness of the model chosen for the specific situation.
The models are discussed in more detail with their features, advantages, and disadvantages to help decide the most suitable one for the given situation.
The simpler models are less precise but require fewer assumptions, while the more complex models can be more accurate but require more data and more assumptions, introducing potential for error.
Zero Growth DDM
The conventional model, often known as the zero growth model, presupposes that dividends won't increase in the future.
It is predicated on the premise that the dividend will never change and the business won't expand. It is a quantitative method used to determine a stock's value.
This method helps to calculate the fair value of a stock irrespective of the prevalent market conditions by considering the dividend payout factors and the expected returns from the market.
If the value obtained from this method is higher than the current trading price, the stock is termed undervalued, whereas if the value obtained is lower than the current trading price, the store is termed overvalued.
It is based on the assumption that the intrinsic value of a stock reflects the present value of all future cash flows generated from it. If you buy a stock and never intend to sell it, the future cash flows generated from the store are its dividends.
A company runs to earn profits. The cash flow generated by the operations of an enterprise determines its earnings, which is also reflected in the firm's stock prices. The dividend payment made by the company usually arises from its profits as well.
From a mathematical perspective, it provides an easy way to calculate the fair price of a stock as it requires minimum input variables. However, the assumptions made to estimate the reasonable price cannot be easily forecasted.
It assumes that the future dividend payments of a company will continue to grow at their past growth rate. This method is especially helpful to investors looking to buy dividend stocks to know how much of the share's price is supported by future dividends.
Some examples of dividend aristocrats are:

Therefore, the DDM is of importance in valuing these listed companies. The basis on which this method relies is the time value of money. The time value of the state that the value of money decreases with time compared to its current value.
Suppose you have two options:
-
You can get $1000 now
-
You can get $1000 a year later
Most of us will choose the first option because if we take the money now, we can invest it or deposit it in the bank. For example, suppose the rate of interest is 10%. Then, after a year, you will have $1100 with you.
This model states that the annual dividend divided by the discount rate equals the stock price.
P0 = Div / r
Where,
- P0 = stock's intrinsic value
- Div = Annual Dividends
- r = Discount Rate
This formula is based on the formula of perpetuity:
P0 = Div / 1 + r + ( Div / ( 1 + r )2 ) + ( Div / ( 1+ r )3 ) + ....... = Div / r
Because preferred stocks pay a dividend equal to a predetermined portion of their par value, this equation can be used to determine their value.
Preferred stock is a stock that gets preference in paying dividends compared to common stock.
When the discount rate, or the perceived risk, changes, the price of a stock based on the zero-growth model also changes.
For example, if a preferred stock pays dividends of $2.40 annually, and the required rate of return for the stock is 11%, then its:
Intrinsic Value = $2.40 / 0.11 = $21.818
The major drawback of this concept is that, as most businesses develop over time, so does the dividend payout.
Constant Growth DDM or Gordon Growth Model
This model was named after American Economist Myron J. Gordon of the Massachusetts Institute of Technology, the University of Rochester, and the University of Toronto, who published it along with Eli Shapiro in 1956.
It is the most commonly used model. This model assumes that dividend growth will remain constant indefinitely. It is used to appraise well-established companies like Walmart that have steadily increasing dividends.
Although dividend growth is steady, the actual value does rise annually. It gives the present value of infinite future dividends growing at a constant rate.
The concept can only be used for corporations that consistently distribute dividends. This is because certain assumptions regarding the dividends that would have been paid otherwise must be made to determine the worth of a company that doesn't pay dividends.
The model considers three elements for determining the company's value:

-
The expected value of the upcoming year's dividend
-
The cost of equity for the business
-
The dividend growth rate over time
The formula for the Gordon Growth Model is expressed as:
P0= Div / r- g
Where,
- P0 = stock's intrinsic value
- Div = Annual Dividends
- r = Discount Rate (usually calculated using Capital Asset Pricing Model)
- g = Constant growth rate of the company's dividends
This formula is used when the stock is bought to retain it for a long time.
Suppose the next year's estimated dividend for a stock is $5, the required rate of return is 17%, and dividends grow at a constant rate of 5%; then, its:
Intrinsic Value = $5 / 17% - 5% = $41.67
Variable Growth DDM
This model is more accurate than the zero growth and constant growth dividend discount models.
In reality, various factors affect how much money businesses make from one quarter to the next and from one year to the next. For example, dividends vary due to differences in profits.
By anticipating that the company will go through multiple growth periods, it eliminates the issue of inconsistent dividend payments.This model is also known as the multi-stage dividend discount model.
The model can take on several forms. It might be assumed that the rate fluctuates annually.The more mature the company and the more steady and predictable the dividend growth rate, the fewer stages are required to be assumed.
However, the most typical supposition is that three different growth rates are taken into account:
-
An initial high growth rate
-
A transition to slower growth
-
A sustainable, constant growth rate
For example, one can assume that a company will have a dividend that grows at 7% for the first 9 years, 5% for the following 5 years, and then at 3% in perpetuity.
This model is an extension of the constant growth DDM.
The same formula is used but using different growth rates for different phases and finally adding the present value of all the stages to get the stock's intrinsic value.
It is assumed that the investor intends to hold the stock for a long.
This model, however, takes even more assumptions into account. For example, contrary to the constant growth model, it makes assumptions about when and how much the dividend will change over time rather than assuming that it will increase steadily.
Dividend forecasting for various periods is necessary.
In addition, the variable growth model is split into two components:
Two-Stage DDM
Given that they consistently pay dividends and experience steady growth, companies with high dividend payout ratios, like Coca-Cola and PepsiCo, are good candidates for this model.
The dividend payout ratio is thought to be constant.It is used to determine the intrinsic value of a company's stock that has seen two distinct growth phases, including an initial period of higher growth and a later era of stable growth.
Its relevance is thus restricted to businesses that initially go through a period of rapid expansion and then experience consistent, stable growth, with little difference between the two stages.
It works best for businesses with moderate growth and distributes residual cash as dividends. For example, a company can grow at 15% in the high growth period and 7% in the subsequent period until perpetuity.
The approach can also appraise businesses that experience short-term low or even negative growth before returning to long-term consistent and stable growth. The limitation of this model is that there can be errors in estimating the length of the first phase.
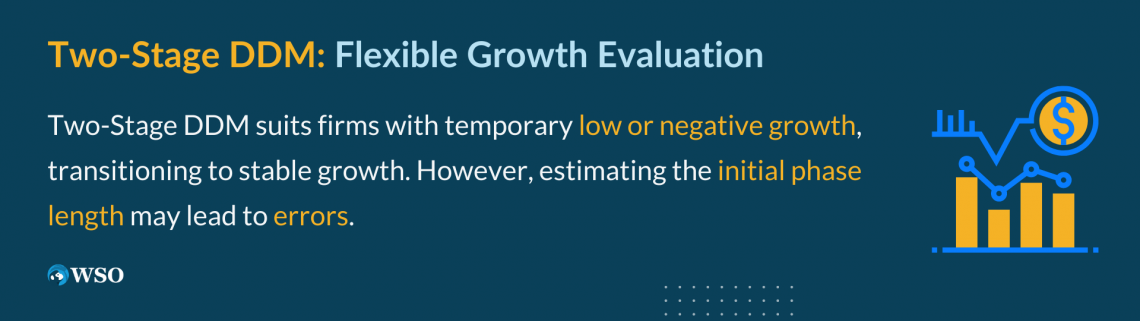
It can lead to overvaluation or undervaluation of the stock. For example, if the first stage is assumed to be shorter, the stock will be undervalued, whereas if the first stage is longer, the stock will get overvalued as we take a high growth period.
Moreover, one can assume a direct shift from, for example, 15% to 3%. However, this doesn't happen, as the growth rate gradually reduces over multiple stages.
Three-Stage DDM
Assuming that the growth rate changes gradually rather than abruptly, the three-stage DDM outperforms the two-stage DDM.
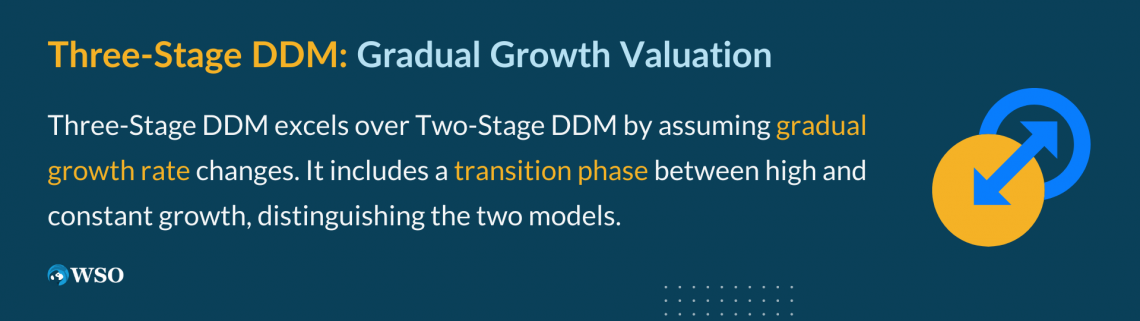
The only difference between the two-stage DDM and the three-stage DDM is that instead of two phases, there is a middle phase, the transition phase, between the high growth rate and the lower constant growth rate.
For example, a stock grows at 10% in the first, i.e., the high growth phase, then at 7% in the transition phase, and finally at 5% constantly until perpetuity.
This model is suitable for a firm that is expected to grow at a higher rate initially, but the rate is expected to decline gradually to become stable as the firm becomes larger and loses its competitive advantages.
It is the most reliable of all the models to accurately reflect the value of a stock based on actual dividend data due to the intricacy of the formula and the variety of growth rates it can handle.
Advantages of DDM
The DDM values the stock based on the future cash flows, given that the future cash flows are considered dividends.
Many analysts prefer this model as it has very little subjectivity in it. The model is simple and easy to understand. Investors prefer stocks that pay regular dividends as it implies that the company has matured and there is not much volatility associated with the growth rates and earnings.
Companies usually don't manipulate dividend payments as it can directly lead to stock price volatility, so businesses keep them in harmony with their fundamentals.
There is clarity about what constitutes dividends, whereas there might be contradicting opinions about earnings and free cash flow. Thus, the model is reliable.
The model allows valuing a stock exclusive of the current market conditions. Thus, one can directly compare companies even if they belong to different industries.
Investors who believe that the intrinsic value of a stock can be computed using the discounted value of its future dividend payments can use the model for identifying overbought or oversold stocks.
The models' strong theoretical foundation and capacity to maintain consistency throughout the company's existence are further benefits.
Shortcomings of the DDM
Since future dividends must be predicted, this model necessitates much speculation. However, even when applying it to stable, reliable corporations that pay dividends, many predictions regarding their future success are made.
One mistakenly assumes that the company will continue to pay a constant dividend forever, which is untrue even for stable, consistent dividend payers.
The model's output will be unreliable if the inputs used are unreliable. The assumptions used have a significant impact on the formula.
As businesses operate in a dynamic environment, dividend payments made by a firm alter over time. Therefore, even a small forecasting inaccuracy could cause the stock to be undervalued or overvalued.
Furthermore, because most high-growth stocks don't pay dividends and instead reinvest their profits in the company, no DDM model can calculate their market value. Since using the long-term interest rate is only sometimes accurate, estimating the projected rate of return is difficult.
The model's fundamental premise—that dividends are the only kind of return on investment for the stock—is incorrect. Despite giving investors a return in the form of capital gains, the approach cannot be utilized to value stocks that do not pay dividends.
Companies prefer stock buybacks over dividends due to tax benefits in most nations; this model ignores the benefit of which to the shareholder.
It is not appropriate for businesses where the needed rate of return is less than the rate of dividend increase since the stock price will produce unclear results.
The valuation will be incorrect if a poorly managed company continues to pay out high dividends despite making insufficient profits because of bad management or concern over a drop in stock prices.
Companies may sometimes borrow money to pay dividends to maintain a consistent dividend policy. However, since they need a significant track record of dividend payments, they cannot be utilized to appraise new or startup businesses.
DDM vs. DCF: Intrinsic Value Methodologies
Investors use both DDM and DCF to find the stock's intrinsic value.
By the discounted cash flow model, a firm is worth the sum of its discounted future free cash flows, whereas by the dividend discount model, a company is worth the present value of its future dividends.
Future dividends are taken into account as future corporate cash flows in DDM. The company's future dividends in DDM are based on the Dividend Per Share, and its growth rate is assumed, which is discounted using the cost of equity.
Based on the company's profitability margins, revenue growth rate, free cash flow conversion ratio, etc., DCF forecasts the company's future free cash flows. Leveraged DCFs and the DDM establish equity value, whereas unlevered DCFs yield enterprise value.
DDM is better suited to a business with a track record of dividend payments. If a company doesn't pay a dividend, then the amount of the dividend and its growth rate is assumed to find the intrinsic value of the stock, thus making the DCF model more reliable.
Moreover, in some cases, there may be a better factor to value a company than the amount of dividend paid. Investors rely on the DCF more than the DDM.
Dividend Discount Model FAQs

DDM, or dividend discount model, is a term in which the sum of the present value of a stock's potential dividends is used to determine its intrinsic value.
The approach is most helpful to investors who want to purchase shares to receive dividend returns.
However, DDM is not the best model to apply if an investor wishes to purchase a share for capital gains.
The stock is undervalued if the DDM value exceeds its present selling price. Conversely, the stock is overvalued if its value exceeds its current selling price.
Based on the company's historical dividend growth rate, the DDM considers future dividend payments.
The Capital Asset Pricing Model (CAPM) is superior to the Dividend Discount Model (DDM) in that the former can be used for any investment while the latter can only be applied to dividend-paying equities.
Researched and authored by Harveen Kaur Ahluwalia | LinkedIn
Free Resources
To continue learning and advancing your career, check out these additional helpful WSO resources:


or Want to Sign up with your social account?