LTM vs. NTM
Both are important in valuation modeling comparable company analysis or past transaction analysis.

LTM vs. NTM Valuation Multiples
LTM stands for the Last Twelve Months, and NTM stands for the Next Twelve Months. Understanding both NTM and LTM valuation multiples is important in valuation modeling comparable company analysis or past transaction analysis.
Multiples are important financial measurement tools that help evaluate companies' financial metrics compared to comparable companies. There are two types of valuation multiples – equity value and enterprise value types.
In any multiple, there will be both a numerator and a denominator in the multiple before both are factored in to create the valuation multiple. The numerator is the company's valuation, usually seeing itself in Enterprise Value or Equity value.
The denominator, on the other hand, will be the company's performance indicators. This comes in the form of sales numbers of revenue, net income, EBIT, or EBITDA sales numbers.
Peer companies can be easily evaluated by using valuation multiples, which would prove to be useful in comparable company analysis. In terms of past transactions, getting a valuation multiple from past companies that are in a comparable universe would also be helpful.
- LTM (Last Twelve Months) and NTM (Next Twelve Months) valuation multiples are important in financial analysis, especially in comparable company analysis or past transaction analysis.
- Valuation multiples help evaluate a company's financial metrics compared to its peers and come in two types: equity value and enterprise value multiples.
- LTM multiples use actual performance indicators, making them accurate, but they may not capture future growth accurately or account for non-recurring expenses.
- NTM multiples are forward-looking and reflect industry trends and high-growth scenarios, but they rely on future projections and expectations, making them more subjective and less accurate.
- It is common to use LTM and NTM multiples together to assess a company's present performance and consider prospects.
- Popular enterprise value multiples include EV/Revenue, EV/EBITDA, EV/EBIT, EV/Capital Employed, and EV/FCFF.
- Popular equity value multiples include P/E (price-to-earnings), P/B (price-to-book), price-to-sales, P/CF (price-to-cash flow), and P/TBV (price-to-tangible book value).
Pros and cons of LTM vs. NTM
Listed in the table below are the pros and cons of LTM and NTM. As seen from the table below, both have their advantages and disadvantages, and there is no one best way to calculate or access valuation multiples.

However, there are preferred ways to calculate them based on the needs and wants of the calculations being made.
| Pros | Cons | |
|---|---|---|
| LTM | Actual performance indicators are used; therefore, these valuation multiples are accurate and correct. | Growth prospects in the future that are different for companies that previously had similar growth models but chose to change might not have a very accurate multiple recorded. Distorted from non-recurring expenses that are not properly “scrubbed”. |
| NTM | If the market/industry is forward-looking, NTM valuations are more reflective of the industry. For instance, if the company is displaying significantly high growth that using LTM rates cannot capture. Accounts for seasonality, such as holiday seasons can be easily factored into calculations vis-a-vis LTM, which might double-count seasonal events. | Very subject to biases, future guesswork, and expectations for the company that might not come through. Performance indicators are less accurate as they have to be entirely forecasted. |
Nevertheless, LTM and NTM valuation multiples are often used in conjunction with each other as using both valuation multiples would best help to calculate and assess a company’s present performance.
Popular multiples used
Most popular multiples involve enterprise and equity values in the denominator to access the company’s profile. Some multiples are very industry-specific and involve measuring physical rather than financial traits.

Multiples are used in the assessment of comparable companies. Using these valuation multiples, important values such as the enterprise value and the equity value will be compared with the company's current values.
By examining the discrepancy between the two, one can conclude how different the company is from the universe of comparable companies in the same industry.
With proper assessments of how the company should be priced, along with its growth prospects, investors have a more informed opinion.
Importantly, this approach assumes that the ratio used in comparable firms, such as operating margins or cost of goods, are similar enough to be compared through valuation multiples.
These include areas such as telecommunications of EV/access lines or EV/population telecommunications. For the sake of brevity, we will go through only popular ones that are used across the board.
Here are some of the popular ones used for both enterprise value and equity value:
What Is Enterprise Value (EV)?
Enterprise value (EV) is a crucial metric in valuation, and various multiples can be used to assess a company's financial performance and potential.
Understanding these multiples and their applications is crucial for comprehensive company valuation, allowing investors and analysts to gain insights into various aspects of a company's financial performance, growth potential, and investment attractiveness.
Furthermore, it's essential to consider industry-specific factors when using these multiples. Industries with unique characteristics may require specific multiples tailored to their particular metrics and dynamics.
For instance, technology companies might focus on EV/Revenue to account for their rapid growth potential. At the same time, capital-intensive industries might prioritize EV/EBIT or EV/Capital Employed to evaluate profitability and efficient use of capital.
Ultimately, the choice of multiples depends on the purpose of the analysis and the specific characteristics of the company being evaluated.
Analysts should consider a range of multiples and employ them in combination with qualitative factors to understand a company's value proposition and investment potential comprehensively.
By utilizing these multiples effectively, investors and analysts can make more informed decisions, mitigate risks, and uncover potential investment opportunities in enterprise valuation's dynamic and complex world.
Enterprise Value/Revenue
Useful in the calculations of early-stage/high-growth companies with still limited profitability. If current operations are stipulated not to impact future growth/future performance highly, then this matrix is more studied in calculations.
For companies with negative profitability (in terms of EBIT) or net income, it might decide to use EV/Revenue, justifying it by saying that the industry is a growing one, and likewise, their company.
This is a double-edged sword in itself, as although this accounts for growth and early-stage companies, it ignores profitability and cash flow generation on account of calculating only the company's sales value.
EV/ Revenue = Enterprise Value/ Revenue = (Market Cap + Debt - Cash and Equivalents)/ Revenue
However, the matrix is not usually favored. This is because very little information about expenses is reflected through the multiple. A very speculative approach is used to approach valuation against other companies in the same industry.
A higher multiple is indicative of the market pricing in expectations of the company having the capacity to generate greater revenue in the future.
Enterprise Value/Earnings Before Interest Taxes Dividends and Amortizations
Used favorably as it looks at the profit-making ability of a firm that investors are interested in finding out. This is the most popular enterprise value valuation multiple.
Companies might sometimes use different methods to price in depreciation and amortization, which can significantly skew the profitability between two similar firms in the same industry only depending on accounting matrices.
However, the multiple fails to value companies with different levels of capital intensity. A firm with a much higher capital overlay might reflect the same as another firm with a lower capital overlay if the company's profitability is the same.
Furthermore, keep in mind that only comparable companies can be evaluated through valuation metrics. Ensure that the companies you are comparing using this metric are in the same comparable universe of companies in the same industry.
The ratio directs the question of each dollar amount in profits (EBITDA) investors are willing to take on for increases in enterprise value, which is important in evaluating cash flow in further calculations later.
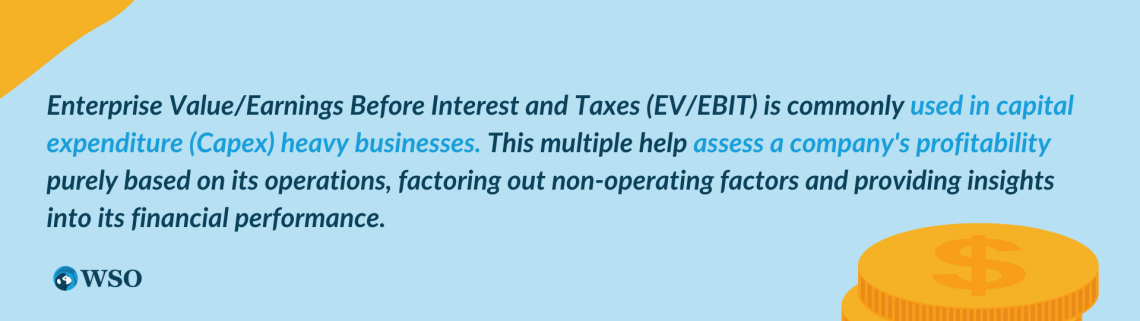
Enterprise Value/Earnings Before Interest and Taxes
Used favorably in capex-heavy businesses as depreciation and amortization that is removed in EBIT (but not in EBITDA calculations) serve as an appropriate proxy for capex. Factoring it into calculations would help to factor in capex as well.
There are various ways to calculate EBIT, formulas as listed below:
EBIT = Net Income + Interest + Taxes
Alternatively,
EBIT = Revenue - Cost of Goods Sold - Operating Expenses
By factoring in depreciation and amortization, this captures any difference in depreciation policies, along with the capital structure of the firm, i.e., a firm with higher capital intensity would be penalized more heavily in this aspect and would reflect a lower EV/EBIT than firms that earn the same profit and have a lower capital intensity.
Take note that EBIT is also employed because of its ability to factor out certain discretionary moves by the company. For instance, in debt financing(capital structure), the calculations factor out taxes.
Further, non-core income sources (such as interest income) or one-time corporate decisions (such as divestitures or impairments to PPE/intangibles) are written off. This would help to best calculate the company's profitability purely for its operations.
Enterprise Value/Capital Employed
Capital employed refers to the total amount of capital invested in the business. Directly, it can be calculated by adding fixed capital to working capital. An alternative calculation form would be subtracting current liabilities from total assets.
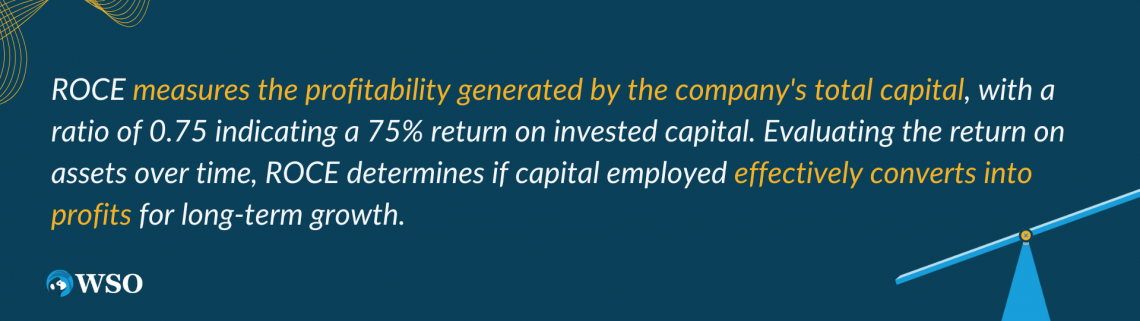
EBIT/Capital employed (ROCE) directly measures how much profit the company generates through its total capital in the business.
For instance, an ROCE of 0.75 means that with every dollar invested into the company through capital employed, a return of 75 cents is generated as profits.
This ratio is useful to evaluate the return on assets in a company over a long time. This metric can easily access long-term growth as it directly measures whether capital employed is being put to good work to convert into profits.
By factoring this into EV/Capital Employed, benefits conferred to ROCE (to aid in the factoring of long-term growth for the company) are applied to EV/Capital Employed as well.
To link this to calculating the EV/Capital employed to calculate the EV is through further manipulation of the ROCE, namely:
EV/Capital Employed = EBIT/ Capital Employed (ROCE) x EV/EBIT
Enterprise Value/Free Cash Flow to the Firm
Free Cash Flow to the Firm (FCFF) refers to unlevered free cash flow of the dollar amount of profits attained by a company that is owed to all stakeholders, including debt and equity holders.
EV/FCFF = EV/ [EBIT(1 - tax rate) + non-cash charge - weighted capital investments - fixed capital investments]
Specifically, FCFF is used in this instance as enterprise value takes into the value of company operations for all investors. FCFF measures the FCF generated by company operations for all involved stakeholders.
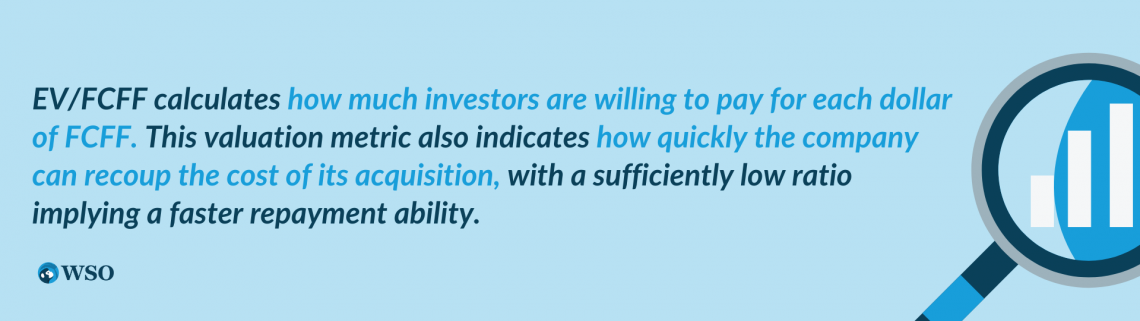
This calculates how much investors are willing to pay for each dollar of FCFF for the firm. If, for instance, the EV/FCFF value was 1.5, this indicates that investors are willing to pay $1.5 for an extra dollar to FCFF.
Alternatively, this valuation metric shows how quickly the company might be able to repurchase the entire cost of its acquisition.
Since EV is roughly an estimate for the value of the entire firm ( as it takes into account debt and cash amount for the firm). If the ratio is sufficiently low, the company can repay its cost of acquisition rather quickly.
What Is Equity Value?
Equity refers directly to the public's ownership of a publicly traded company. This is also referred to as market capitalization. It helps equity investors realize the value of their equity if they sell to the market to realize immediate gains.

To calculate equity value, the price of the stock (spot price) is multiplied by the number of shares outstanding.
Companies might sometimes use different methods to price in depreciation and amortization, which can significantly skew the profitability between two similar firms in the same industry only depending on accounting matrices.
NOTE
Take note that since equity value only caters to equity investors, the very literal reasoning of calculating equity value is to evaluate the value reminding for shareholders after debts are fully paid off, as sold to the market immediately at the market price it is accorded.
Several valuation metrics use equity value in their calculations, like price to earnings per share. These ratios provide insights into the market's perception of a company's financial performance and growth potential.
Price/Earnings (price-to-earnings ratio)
The Price/Earnings Per Share ratio measures how much investors are willing to pay for an exact dollar of the company’s net profit.
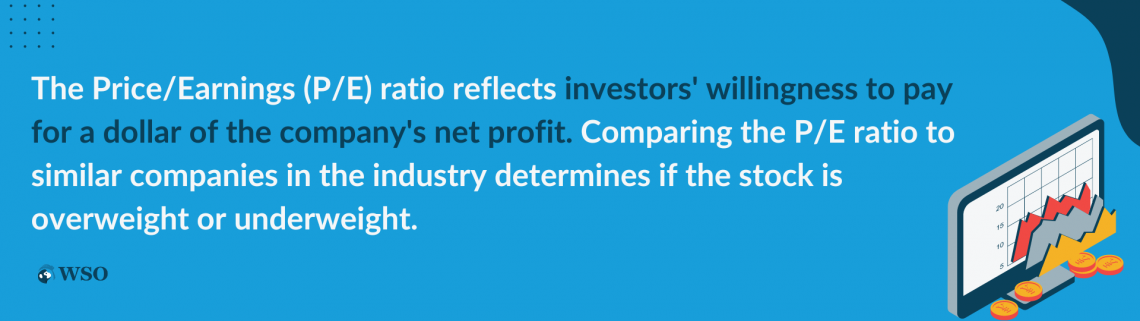
This helps to examine the overweight/underweight nature of the stock. If compared to the universe of comparable companies in the same industry, the stock has a comparatively higher P/E ratio; then it is usually overweight.
If other companies in the same industry have a lower P/E ratio, then the company is seen as comparatively underweight.
P/E is one of the most common valuation matrices. Data is easily available for being able to calculate this, such as the market price of the stock is easily available, as well as the earnings per share(EPS), which explains its popularity for use by investors.
As a result, using this to compare companies with other ones in similar industries is an examination into whether the stock is overbought/overweight or underbought/underweight.
Further, an alternative form of calculation for this metric is the formula equity value/net income. This explains why P/E is also seen as a valuation metric for equity value, with the two values similar/comparable.
There are also varying types of P/E ratios that can be used.
- Trailing P/E
- Forward P/E
- Justified P/E
- For trailing P/E, a historical value of earnings per share is used. Since the market data of earnings per share always lags compared to the current share price, which is what the market is currently pricing the shares, trailing P/E is most commonly used.
- For forward P/E, forecasted earnings per share are used in place of the current earnings per share.
However, since the forecasted earnings per share have not yet happened, this is subject to the opinions of the market and therefore relies on what the market thinks the company earnings per share is (subject to biases).
NOTE
P/E ratios account for the amount of time required for the company's earnings to catch up with the market price. For instance, a P/E of 3.4 indicates that the stockholders are willing to hold the stock for 3.4 years to regain 100% of their original stock.
Some companies cannot have tenable P/Es that are justified based on what people purchase the shares for. For instance, Tesla once had a P/E of 1200 for its stock; however, this does not mean that people were willing to wait 1200 years for Tesla.
Therefore, another form of P/E comes from justified P/E. This is a P/E that is calculated based on the Gordon-Growth model, which assumes constant growth for the company. Hence, this P/E ratio is “justified” according to the matrices of the current market for the company.
The justified P/E is calculated like so:
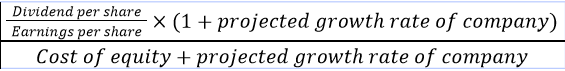
In all, all the P/E ratios have to be compared vis-a-vis each other to come with a fair/comparable judgment to other industry peers, along with the justified P/E to calculate the underweight/overweight nature of the stock fairly.
Price/Book value
P/B is referred to as price to book value. This is calculated by market capitalization/book value of equity or market price of shares/book value of equity per share. As the book value refers to the accrual value assigned to assets, the value can be easily extracted from balance sheets.

This value is usually used for mature companies and is useful for companies that are asset heavy, as it would be a more accurate reflection of their value using book value. This is opposed to software company types, where their assets are not easily calculable through intangibles.
Banks are also particularly good at calculating and accessing using the P/B ratio. This is because most of their assets held are in stocks and debt and, therefore, are reflected in the balance sheets as marked to market already.
Calculating the banks’ P/B ratio reflects the current assets the banks have and, therefore, best accesses the efficiency of fund utilization for banks. Since all banks have mark-to-market accounting, using the P/B ratio shows best the fund utilization banks have.
Price-to-sales
The price-to-sales ratio assesses the market value of the shares(placed by investors) to the company's revenue.

Price-to-sales = Market Capital/ Revenue
Price-to-sales ratio is the latest closing price/revenue per share. Alternatively, market capitalization/annual revenue is another method to calculate the price-to-sales ratio.
The price-to-sales ratio is important as it shows how the market values every dollar of the company’s sales. This means that similar to EV/revenue, it is used for companies that have yet to turn a profit/high growth companies.
This metric is also useful in evaluating companies that do not yet have any sustainable form of earnings, for instance, companies that are drawing losses.
This metric is also useful in growth companies, which might be breaking even only in terms of profitability. In this case, revenue is a suitable metric for assessing the company’s potential.
Since sales are evaluated in revenue which will still be generated even in a year with negative profits, price to sales is a suitable indicator.
Price/Cash Flow
Price to cash flow can be calculated through market capitalization/cash flow from operations. Unlike for EV, since CF is used in conjunction with price (of the share), which is an equity value metric, the cash flow used here should be a levered metric.

As operating cash flow per share is used, levered cash flow is first calculated. The difference between the cash flow and the non-cash charges is then calculated, and the remainder is used to calculate the operating cash flow per share.
P/CF = Share Price/Operating Cash Flow per Share
This metric represents the dollar amount a shareholder is willing to put for a dollar value of (levered) cash flow for the company. This is particularly useful in accessing companies with a positive free cash flow value but might reflect negative profits due to high non-cash charges.
For instance, if the company reflects a high level of depreciation/amortization in its operating profit/income, which reflects a negative profit, using P/CF is useful as it removes the effect of non-cash charges and, therefore, reflects more accurately into the company measurements.
Price/Tangible Book Value
The price/tangible book value(TBV) is the market capitalization (of the stock)/tangible book value.

P/TBV = Price/Tangible Book Value per Share
TBV refers to how much a company’s tangible book assets are worth, which means total assets-intangible assets (such as goodwill, intangibles, etc.). This is further calculated through the book value of equity–intangible assets.
This is useful in valuing companies ability to repay common equity holders after it has fully liquidated all its assets. During a liquidation process, only the tangible value of assets is considered.
Companies that also have a very high amount of capital intensive with a high proportion of hard assets are valued strongly through this. Comparing firms in industries that have a relatively high proportion of this suits the intention of the valuation metric (e.g., railway companies).
Although during a liquidation, some intangible assets can still be priced and sold (e.g., patents), using P/TBV is a very conservative estimate that some investors opt to use to access a company.
This metric is similar to P/B; however, P/B takes into account intangible assets as well, while P/TBV reflects only tangible assets.
Conclusion
In conclusion, understanding both LTM (Last Twelve Months) and NTM (Next Twelve Months) valuation multiples is crucial in financial analysis, particularly in comparable company analysis or past transaction analysis.
Valuation multiples provide valuable insights into a company's financial metrics compared to its peers.
LTM valuation multiples offer the advantage of using actual performance indicators, making them accurate and reliable. However, they may not capture future growth prospects accurately, especially if companies with similar growth models decide to make significant changes.
LTM multiples can also be distorted by non-recurring expenses that are not properly accounted for.
On the other hand, NTM valuation multiples are forward-looking and can better reflect industry trends and high-growth scenarios. They account for seasonality and can factor in events like holiday seasons.
However, NTM multiples rely heavily on future projections and expectations, making them more subject to biases and guesswork. The performance indicators used in NTM multiples are entirely forecasted, which may introduce inaccuracies.
NOTE
While LTM and NTM valuation multiples have pros and cons, they are used together to provide an assessment of a company's present performance. It is important to select appropriate valuation multiples based on specific analysis requirements and the industry in focus.
In the realm of enterprise value multiples, some popular ones include EV/Revenue, which is useful for early-stage or high-growth companies, and EV/EBITDA, which measures a firm's profit-making ability.
EV/EBIT is favored in capital-intensive businesses, and EV/Capital Employed helps evaluate the return of assets over time. EV/FCFF assesses the value investors are willing to pay for each dollar of free cash flow to the firm.

For equity value multiples, the P/E (price-to-earnings) ratio is commonly used to gauge investors' willingness to pay for a company's net profit. P/B (price-to-book) ratio is suitable for asset-heavy mature companies, while the price-to-sales ratio is valuable for evaluating companies without sustainable earnings.
P/CF (price-to-cash flow) considers levered cash flow, and P/TBV (price-to-tangible book value) estimates a company's ability to repay equity holders after liquidation.
Valuation multiples play a significant role in assessing a company's financial performance and comparing it to its peers. They provide valuable insights into various aspects of a company's operations and help investors make informed decisions.
LTM Vs. NTM Valuation Multiples FAQs

LTM stands for the Last Twelve Months, and NTM stands for Next Twelve Months. These valuation multiples are used in financial analysis to assess a company's financial metrics over a specific period.
Equity value multiples consider the valuation of the company's equity alone. Enterprise value multiples take into account the valuation of the entire company, including debt the company took on and cash and the equivalents it has.
Popular enterprise value multiples include EV/Revenue (useful for early-stage or high-growth companies) or EV/EBITDA(measures a firm's profit-making ability). Other multiples include EV/EBIT and EV/Capital Employed.
The most popular equity value multiple is the P/E ratio, which measures the price investors are willing to pay for each dollar of net profit. There are other multiples of the P/B (price-to-book) ratio, price-to-sales ratio, P/CF (price-to-cash flow), and P/TBV (price-to-tangible book value).
Valuation multiples provide insights into a company's financial performance, its position compared to peers, and its attractiveness as an investment opportunity. By comparing multiples, investors can assess the relative value of stocks and make informed decisions.


Free Resources
To continue learning and advancing your career, check out these additional helpful WSO resources:


or Want to Sign up with your social account?