Multiple-Period Dividend Discount Model
It is based on the principle that the value of a stock is the present value of its expected future dividends.


What is the Multiple-Period Dividend Discount Model?
The multiple-period dividend discount model is a variant of the DDM that offers a more comprehensive valuation framework.

At its core, the multiple-period DDM is based on the principle that the value of a stock is the present value of its expected future dividends.
While the single-period DDM assumes a constant dividend growth rate and a single future dividend payment, the multiple-period DDM accounts for changing dividend growth rates and multiple dividends occurring over a specified time horizon.
By incorporating these dynamic factors, the multiple-period DDM provides a more realistic representation of a stock's worth, considering variations in dividend patterns and growth prospects.
The formula for the multiple-period dividend discount model (DDM) can be expressed as:
V0 = D1 / (1 + r)1 + D2 / (1 + r)2 + D3 / (1 + r)3 + …. + Dn / (1 + r) + Pn / (1 + r) n
Where,
- V0 represents the present value or intrinsic value of the stock.
- D1, D2, D3,……., Dn denotes the expected future dividends for each period (1, 2, 3, ..., n).
- r represents the required rate of return, which is the minimum rate of return that investors demand for holding the stock.
- Pn refers to the terminal value or the estimated value of the stock at the end of the nth period.
- The multiple-period dividend discount model is based on the principle that the value of a stock is the present value of its expected future dividends.
- The multiple-period DDM provides a more realistic representation of a stock's worth, considering variations in dividend patterns and growth prospects.
- It considers factors such as the risk-free rate of return, the company's systematic risk (beta), and the equity risk premium.
- Changes in industry dynamics, economic conditions, or company-specific factors can significantly impact future dividend growth rates, making precise predictions difficult.
Understanding Multiple Period Dividend Discount Model
DDMs assume that dividends are investors' primary source of returns, and the stock's value is derived from the expected stream of future dividend payments. The model assumes that the annual rate at which dividends are anticipated to grow over time remains stable.
Additionally, the required rate of return is a critical component of the multiple-period DDM. It represents the minimum return investors require to compensate for the risk associated with investing in a particular stock.
It considers factors such as the risk-free rate of return, the company's systematic risk (beta), and the equity risk premium.
While DDMs, including the multiple periods DDM, provide a valuable framework for equity valuation, it is important to recognize their limitations. One limitation is the challenge of accurately estimating future dividend growth rates, especially for companies with uncertain or volatile earnings.
Furthermore, DDMs may not be suitable for valuing companies that do not pay dividends or have inconsistent dividend policies. Alternative valuation approaches, such as the discounted cash flow model (DCF model) or the free cash flow to equity model (FCFE model), are more applicable in these circumstances.
Example of Multiple Period Dividend Discount Model
Let's explain the multiple-period dividend discount model (DDM) formula with an example:

Suppose we want to estimate the intrinsic value of a stock, XYZ Company, using the multiple-period DDM. Here are the inputs for our example:
Expected Dividends are:
- Year 1: $1.50
- Year 2: $1.80
- Year 3: $2.10
- Year 4: $2.40
- Year 5: $2.70
Required Rate of Return (Discount Rate): 10%
Terminal Value (Year 5): $50
Now, let's calculate the intrinsic value of the stock using the multiple-period DDM formula:
V0 = (1.50 / (1 + 0.10)1 ) + (1.80 / (1 + 0.10)2) + (2.10 / (1 + 0.10)3) + (2.40 / (1 + 0.10)4) + (2.70 / (1 + 0.10)5) + (50 / (1 + 0.10)5)
V0 = (1.50 / 1.10 ) + (1.80 / (1.10)2) + (2.10 / (1.10)3) + (2.40 / (1.10)4) + (2.70 / (1.10)5) + (50 / (1.10)5)
V0 = (1.50 / 1.10 ) + (1.80 /1.21 ) + (2.10 / 1.33) + (2.40 / 1.46) + (2.70 / 1.61) + (50 / 1.61)
V0 = 1.3636 + 1.4855 + 1.5789 + 1.6438 + 1.6770 + 31.0559
V0 = 38.8047
Therefore, the estimated intrinsic value of the stock XYZ Company, using the multiple period DDM formula, is approximately $38.80.
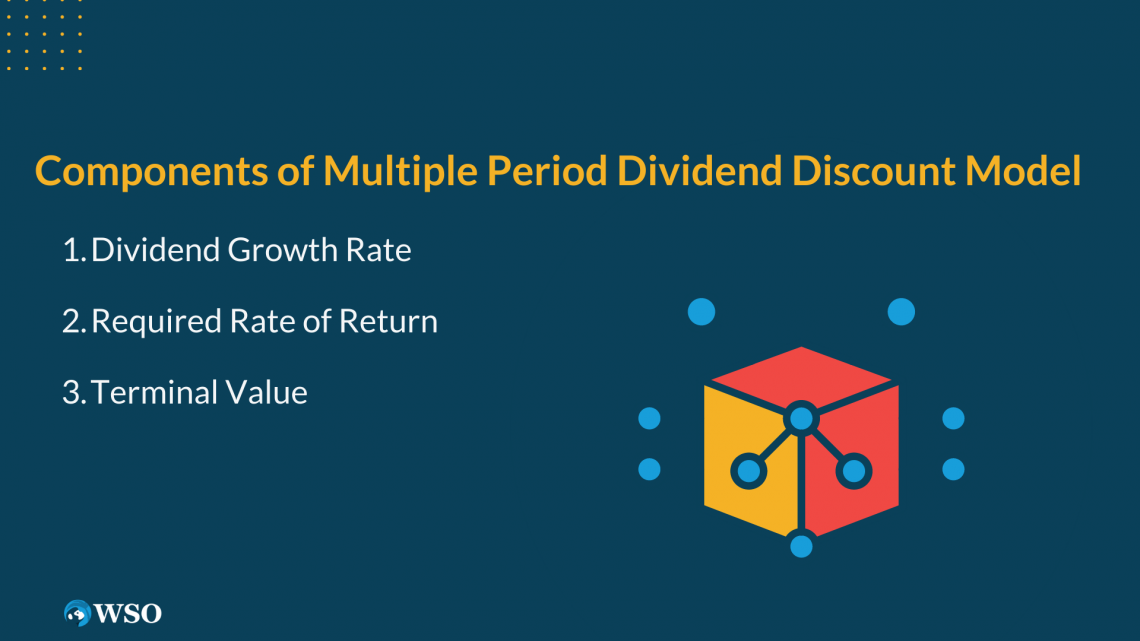
Components of Multiple Period Dividend Discount Model
The multiple-period DDM is built upon several key components essential for estimating a stock's intrinsic value. Understanding these components is crucial in effectively applying the model to equity valuation.
Let's delve into the key components of the multiple-period DDM:
1. Dividend Growth Rate
It is a crucial component of the multiple-period DDM as it determines the future cash flows generated by the stock.
Note
Past dividend growth, business success, industry forecast, and economic conditions are a few variables that can be used to predict the dividend growth rate.
Using reasonable and justifiable dividend growth estimates is important to ensure accurate valuation results.
2. Required Rate of Return
The minimum rate of return that investors expect as payment for the risk involved in owning the stock is known as the needed rate of return. It is also known as the discount or investor's hurdle rate.
Note
Required Rate of Return reflects the opportunity cost of investing in the stock compared to other investment alternatives with similar risk profiles.
The required rate of return is influenced by factors such as the risk-free rate, the company's systematic risk (beta), and the equity risk premium.
Estimating an appropriate required rate of return is crucial as it impacts the present value of future dividends and, therefore, the calculated intrinsic value.
3. Terminal Value
The terminal value is an important component of the multiple-period DDM. It represents the estimated value of the stock at the end of the valuation period, beyond which the model assumes a stable and constant growth rate.
Note
The terminal value can be determined using various approaches, such as applying a multiple to the expected future dividends or using the Gordon growth model to calculate the perpetuity value.
The terminal value accounts for the cash flows beyond the explicit forecasted period and significantly affects the overall intrinsic value of the stock.
Techniques for Estimating Dividend Growth Rates
Estimating dividend growth rates is a crucial component of the multiple-period DDM. Here are some techniques for estimating dividend growth rates:
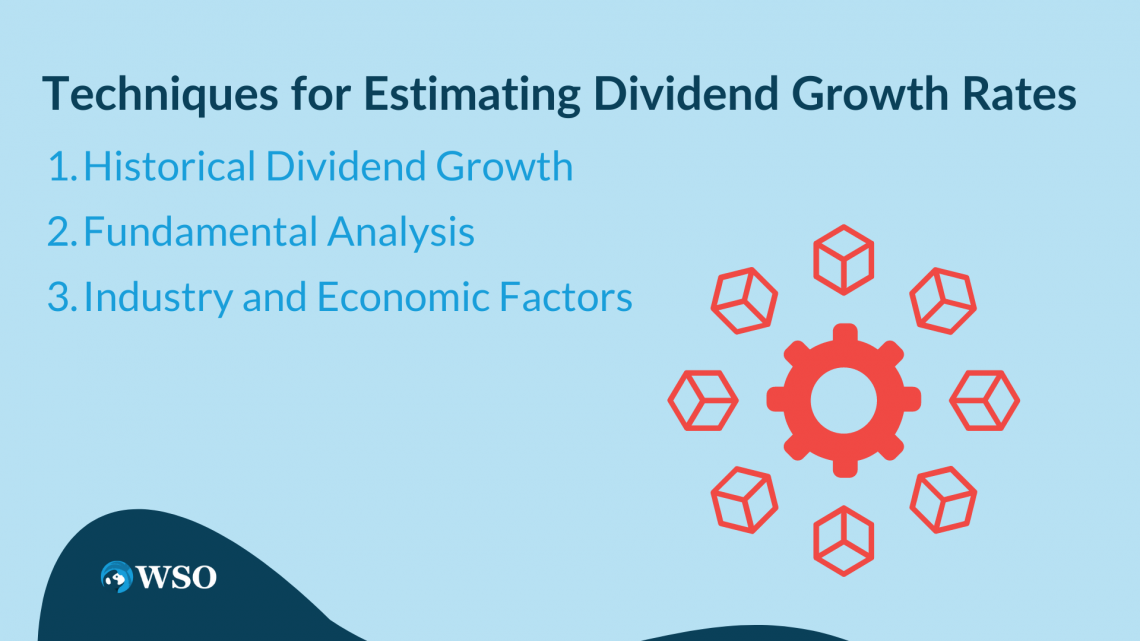
1. Historical Dividend Growth
Insights about a company's dividend payment history can be gained by examining previous dividend growth rates, which can also be used to predict future dividend growth.
By examining the consistency and magnitude of past dividend increases, investors can assess a company's track record in rewarding shareholders and make assumptions about its ability to sustain or improve dividend growth in the future.
Note
Historical growth rates may not always indicate future performance due to changing circumstances and market conditions.
Fundamental analysis involves evaluating a company's financial health, competitive position, industry dynamics, and growth prospects to estimate future dividend growth rates.
Key financial indicators like a company's ability to generate cash flow and increase dividends over time can be seen in key financial measurements like revenue growth and earnings growth.
3. Industry and Economic Factors
Dividend growth rates can be influenced by industry and economic factors. Industry dynamics, such as technological advancements, regulatory changes, and competitive landscapes, can impact companies' growth opportunities and, subsequently, their ability to increase dividends.
For example, during periods of economic expansion, companies may experience higher earnings and cash flows, leading to potential dividend growth.
Conversely, companies may face challenges during economic downturns and opt for more conservative dividend policies. Analyzing industry and economic factors can provide insights into the broader context in which companies operate and help estimate dividend growth rates.
Note
Estimating dividend growth rates involves a degree of uncertainty and requires judgment.
Various factors can affect dividend growth, including company-specific circumstances, industry dynamics, and macroeconomic conditions.
Therefore, it is advisable to consider a range of scenarios and conduct a sensitivity analysis to assess the impact of different dividend growth rate assumptions on valuation results.
Limitations to the Multiple Period Dividend Discount Model
The multiple-period DDM has several limitations that should be considered for stock valuation. These are:
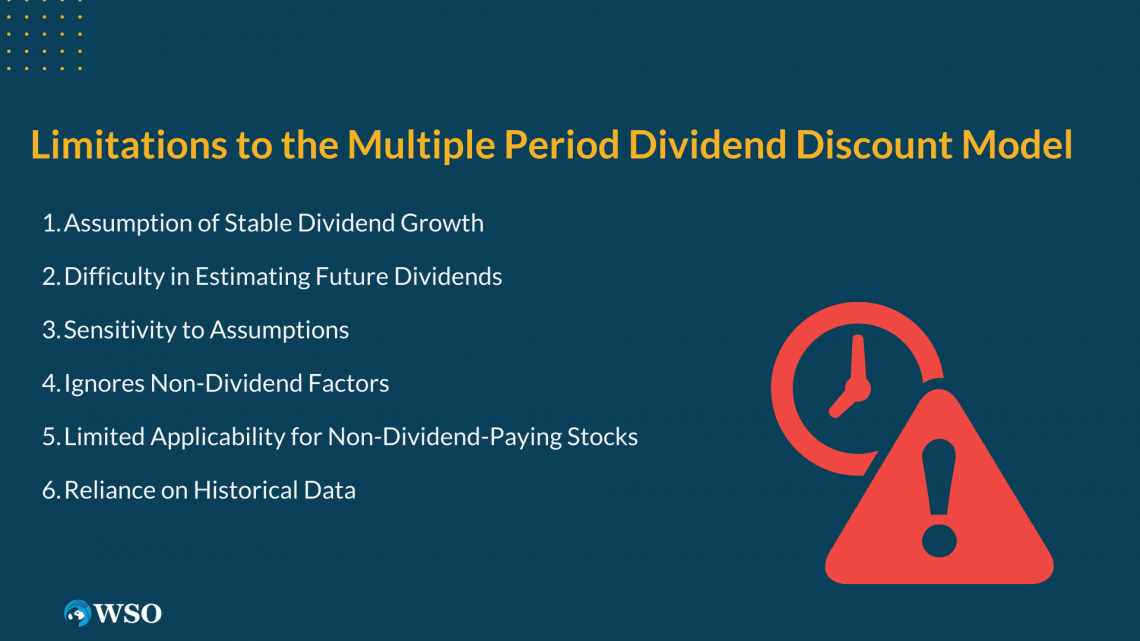
1. Assumption of Stable Dividend Growth
The multiple-period DDM assumes a stable and predictable dividend growth rate throughout the valuation period.
However, dividend growth rates might alter in practice because of several variables, including shifts in the company's financial performance, market conditions, or macroeconomic considerations.
If the dividend growth rate deviates significantly from the assumed stable rate, the estimated intrinsic value may not accurately reflect the stock's true worth.
2. Difficulty in Estimating Future Dividends
It can be difficult to predict future dividends, particularly for businesses with erratic revenues or a lack of a continuous dividend payment history.
The firm's financial health, management choices, and economic conditions are only a few variables that must be considered to make reliable projections about future dividend amounts.
Note
Uncertainty in dividend forecasts can introduce errors in the valuation process.
3. Sensitivity to Assumptions
The multiple-period DDM is sensitive to the assumptions made, particularly regarding dividend growth rates and the required rate of return.
Small changes in these assumptions can significantly impact the calculated intrinsic value. Investors should exercise caution and conduct sensitivity analysis to understand the model's sensitivity to changes in key assumptions.
4. Ignores Non-Dividend Factors
The multiple-period DDM focuses solely on dividends as the basis for valuation.
It doesn't consider additional variables that could affect a stock's value, like capital gains, market mood, or company structure adjustments. This limitation can lead to an incomplete assessment of a stock's true worth.
5. Limited Applicability for Non-Dividend-Paying Stocks
The multiple-period DDM is primarily suitable for dividend-paying stocks. Companies that do not pay dividends or pay them infrequently may require alternative valuation methods such as:
- Discounted cash flow (DCF) analysis
- price-to-earnings (P/E) ratio-based approaches
6. Reliance on Historical Data
The multiple-period DDM often relies on historical data, including past dividend growth rates, to make future projections.
Historical data might not, however, necessarily be a reliable predictor of future performance. Changes in the company's business model, competitive landscape, or industry dynamics may render historical data less reliable for predicting future dividend growth.
Real-world applications of Multiple Period DDM
The multiple-period dividend discount model has found extensive real-world applications in equity valuation and investment analysis.
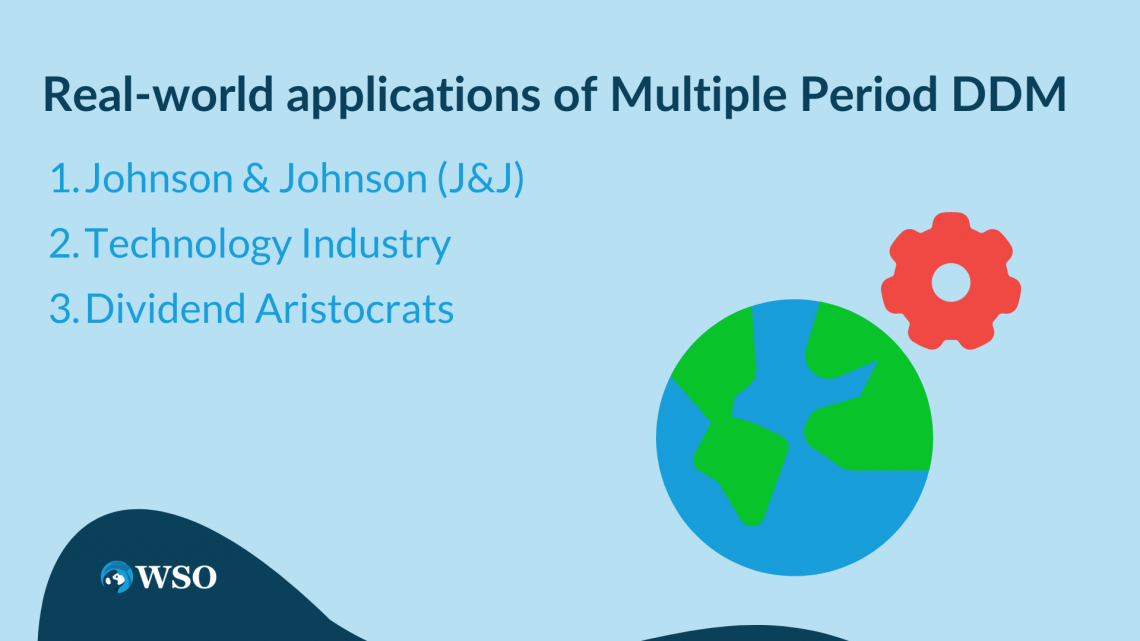
By incorporating changing dividend growth rates and multiple future dividends, this model provides a robust framework for estimating the intrinsic value of a stock.
Let's explore some real-world applications and case studies that highlight the effectiveness of the multiple-period DDM.
1. Johnson & Johnson (J&J)
Johnson & Johnson, a multinational healthcare company, is often cited as a prominent example of applying the multiple-period DDM.
In this case, the multiple-period DDM allows investors to assess the potential returns from investing in J&J by considering the company's reliable dividend track record, commitment to dividend payments, and position in the healthcare industry.
2. Technology Industry
The multiple-period DDM is not limited to specific sectors but can be applied to various industries. Let's consider a case study within the technology sector.
Technology companies often experience high growth rates, making it challenging to predict future dividends accurately. However, by utilizing the multiple-period DDM, analysts can account for changing growth rates and estimate the intrinsic value of technology stocks.
In this case, the multiple-period DDM can be applied to technology companies by considering their revenue growth rates, industry trends, and market conditions.
By incorporating these variables, analysts can forecast future dividend growth rates and assess the fair value of technology stocks.
3. Dividend Aristocrats
Another application of the multiple-period DDM is in the evaluation of Dividend Aristocrats. Dividend Aristocrats have consistently increased their dividends for several consecutive years.
These companies often exhibit stability and a long-term commitment to rewarding shareholders with growing dividends.
This approach helps investors identify companies with a strong track record of dividend growth and evaluate the potential returns from investing in these stable dividend-paying stocks.
Multiple Period Dividend Discount Model FAQs

Single Period DDM assumes that the stock's value is based solely on the dividends expected to be received in the next period. It calculates the intrinsic value of a stock by discounting the expected dividend payment by a required rate of return or discount rate.
Unlike the Single Period DDM, the Multiple Period DDM considers the expected dividends over multiple future periods, considering the growth rate of dividends. It involves projecting dividends for each period and discounting them to their present value.
The model requires expected future dividends, growth rate, discount rate, and terminal value as key inputs.
Expected future dividends can be estimated by analyzing the historical dividend payments, the company's financial health, industry trends, and management's dividend policies.
The discount rate represents the required rate of return that investors expect to earn on their investment.
It incorporates factors such as the risk-free rate of return, the company's systematic risk (beta), and the investor's required rate of return based on their risk tolerance and opportunity cost.
The discount rate is typically derived from the company's cost of equity or the weighted average cost of capital (WACC).
The Multiple Period DDM is one factor to consider when making investment decisions, but it is not the only factor.
A comprehensive investment analysis incorporates multiple valuation methods and considers qualitative and quantitative factors to make well-informed investment decisions.


or Want to Sign up with your social account?