
Excel modeling - backing into contribution profit and gross profit

Recently completed a modeling test, which had one set of formulas related to contribution profit I haven't seen before and I couldn't figure out how to complete it. Essentially, the forecast period had revenue broken down into its price+volume contribution then the contribution profit calculation was fixed so that it took the input of the formulas for how price and volume affected contribution profit. Wondering if anyone has seen this exact modeling test or something similar and could walk me through how to complete it?
(And honestly, it's been about two months and I'm trying to remember how the model was setup exactly and don't so the test could be slightly different than I described) Here's a picture of a simplified version of what I think I recall. 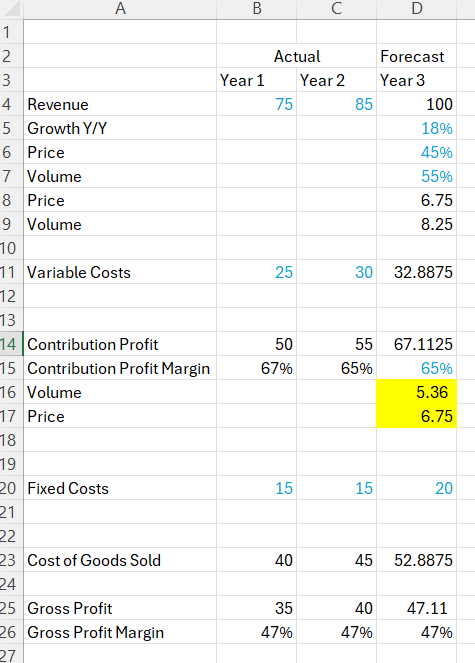






.
.
Congrats on Point72 rejection!
Lol to be fair, it's sector specific like a software, internet, MCO/facilities analyst would never model like this (I also couldn't figure it out haha)
How do you complete this? Can I PM you
actually got advanced despite not completing this section. But the rest was easy and I was interviewing for FIG so I don't think BD cared that I missed this. But got dinged when talking with the PM
p72 test. take the incremental change in rev and * by the incremental contribution margin.
pods LOVE incremental contribution margin. if someone ask about that at a conf - pod.
ironic because it doesn't actually aid in granularity vs understanding where margin moves come from. i.e price/vol/mix vs cost deltas
Helps determine if they are going to beat or miss next qtr esp if you have cc data or whatever
In my example above, I had to make up how the model was setup so it is not perfectly accurate to the test.
But this is what I did in the example in this post - incremental change in revenue ($15) times the % impact due to price and volume ($6.75 due to price and $8.25 for volume) and then each of those incremental revenues times the incremental contribution margin. I thought Price you would assume 100% incremental contribution margin since it has no cost component, and volume would be at the assumed 65% contribution margin (Price contribution margin = $6.75 * 100%) (Volume contribution margin = $8.25*65% = $5.36) but then I get $67.11 contribution profit, which obviously does not square with the expected contribution margin assumption of 65%.
Is this not supposed to total $65? Or did I do a step wrong?
Idk why u assume 100% incremental margin from price i would use the % incr. margin that they give you for price and volume.
I think you drastically overcomplicated this question (p72 likely just looking for you to multiply the 65% hardcoded cell for contribution profit margin by the revenue to get to $65 contribution profit). But I'll address the way you approached the problem and why you got to $67/the mistake you made.
Since they hardcode the 65% CPM, it tells us that for each incremental dollar, the variable cost associated with it is still $0.35. I agree that Price contribution generally falls 100% to the bottom line so if we take a 6.885 incremental increase in price, the contribution margin for the $ associated with volume is no longer 65%. What this is saying is that the incremental variable cost per $ contribution from volume is increasing ($5.355 for the $8.415 contribution from volume).
Earum molestiae in soluta. Numquam dolores sit ratione molestias enim sint sapiente placeat. Quis aut quia recusandae quo voluptatem soluta.
Occaecati quis error et aut est et earum qui. Quia aperiam cum cupiditate ullam ducimus. Assumenda enim sint provident ex repellendus et. Accusantium mollitia quis amet accusamus et. Dolor eaque occaecati ut eos expedita. Voluptas eum numquam suscipit error quis sunt quasi.
See All Comments - 100% Free
WSO depends on everyone being able to pitch in when they know something. Unlock with your email and get bonus: 6 financial modeling lessons free ($199 value)
or Unlock with your social account...