Peer valuation
Greetings,
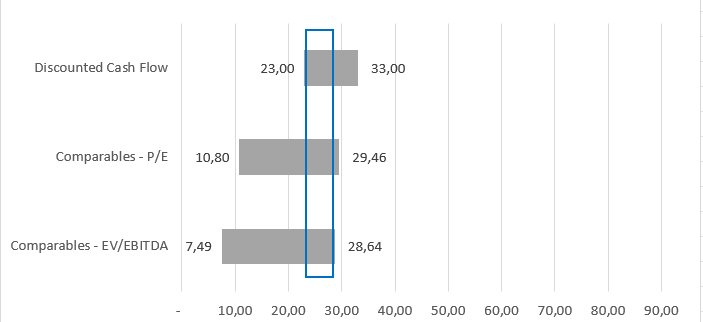
I did this football field of a stock and I'm wondering how do I interpret these results? I mean, they show a wide range if I look at p/e from 10,80-29,46x.
Happy to receive feedback!
Greetings,
I did this football field of a stock and I'm wondering how do I interpret these results? I mean, they show a wide range if I look at p/e from 10,80-29,46x.
Happy to receive feedback!
| +270 | Why UBS Is the Worst Place to Start Your IB Career | 42 | 15h |
| +220 | UBS 2nd Year Analyst Q&A (2026) | 41 | 2d |
| +141 | UBS IB 26Q2 a Disaster! Advisory Revenue Down 23%, Capital MarketsDown 5% | 20 | 10h |
| +135 | Downfall of Qatalyst | 28 | 5h |
| +108 | What's your craziest "hardo" story? | 18 | 1d |
| +86 | Lincoln International Return Offers | 30 | 52m |
| +57 | Wolf of Wall Street vs. Reality: Anyone else feel scammed by the movies? | 19 | 1d |
| +43 | so confused about 28 SA timeline | 30 | 1d |
| +34 | Rate my non-target resume | 19 | 1d |
| +33 | [WSO MODS] Please Delete This BS Host Books Spam! | 2 | 1d |
Career Resources

Get instant access to lessons taught by experienced private equity pros and bulge bracket investment bankers including financial statement modeling, DCF, M&A, LBO, Comps and Excel Modeling.


Normal for there to be a decently wide range - in any peer set there will be better and worse companies. Look at the bottom and top company and figure out why. Did the bottom company miss earnings / has a worse product? Is the top company successful, has a great margin and growing well?
If you can get access to any equity research reports through your school that's even better. Or even if you can find ratings online. Often the bottom company will have a bunch of sell ratings and vice versa for the high multiple company.
Alright, thanks for the input! So basically I just think that it is normal to have a wide spread and I would choose a peer that is so like as possible? For now I had 6 other peers I think in this selection. But also, what would another equity researcher's report help out in this way? Like how can I motivate that if they have a high valuation from another firm, what does that have to do with my opinion or interpretation of my own multiples?
No you don't take "1 peer that you like". If the multiples for your core peer group are all over the place it means that your peer selection sucks or that you're using multiples that aren't adapted to the industry.
Okay so I have to be very selective with the companies I choose and try to filter out peers that is having a too high deviation from my firm?
I would assess where your company sits in the peer group. Are they the best and should be on the high end or are they just middle of the road?
Look at margin, sales growth, profitability etc. This is where "benchmarking" charts can be useful
Equity research is useful because they know the companies intimately and have a good grasp of what is or is not driving growth for the industry. If they say "we're downgrading Company A to Sell because their new product sucks, growth is slowing and we believe they will miss their forecasts this year" that is worth reading and looking into. It's all opinions but it's from people who are very well informed on the company
Okay so you think a football field and a benchmark chart could add value to my valuation together? And if it isen't a public company then I guess I don't have access to er reports but if I would like to get access how do I do that? I mean, I'm not a wealth management customer at most of the banks here.
There's no definitive mechanism for determining the valuation range from the football field. You have to use your own judgement to come up with the reasonable range - the valuations from each method are just data points that support your story and final range.
Maxime eos est excepturi facilis. Laborum ut assumenda quos aut nihil fugiat animi ut. Consequatur qui ipsam alias accusamus saepe nihil. Dignissimos laborum quis vel quo quidem veniam.
Ullam repudiandae voluptas in mollitia ea qui vero. Molestiae molestias mollitia consequatur et. Voluptatum repudiandae sed qui occaecati.
Illo qui perferendis eveniet ex unde repellendus ratione fugiat. Ea vero natus quo voluptatem aliquid quis nemo ad.
See All Comments - 100% Free
WSO depends on everyone being able to pitch in when they know something. Unlock with your email and get bonus: 6 financial modeling lessons free ($199 value)
or Unlock with your social account...