Football Field Graphs
A graph that summarizes a range of values. The graph is commonly used in valuation reports, investment banking pitch books, and fairness opinions


What is a football field graph?
A football field graph summarizes a range of values. The graph received its name based on its visual similarity with the football field. More specifically, the bars on the graph look like yard lines on an actual field.

A football field graph is widely used to compare the results of different valuation methodologies when applied to any given asset or a business in general.
In the finance world, it is used by business and asset valuators, investment bankers, and any other financial professionals who have a goal of summarizing comparable values derived by using different approaches.
Asset Valuation is the process of identifying the fair value of assets. Under International Valuation Standards, there are three main asset valuation approaches:
- The market approach
- The income approach
- The cost approach
Sometimes valuers use different approaches to arrive at the value of assets. When this is the case, they often use a football field graph to present their findings to the client. Popular company valuation methods include:
- Discounted cash flows (DCF)
- Comparable company analysis
- Precedent transaction analysis
- Leveraged buyout analysis (LBO)
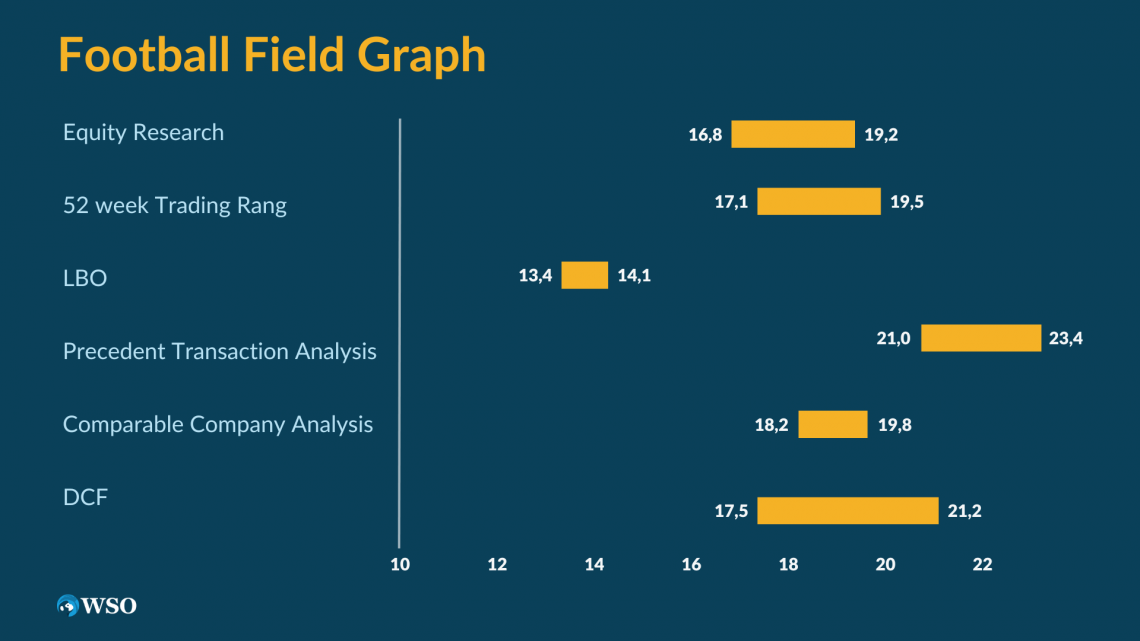
A typical football field graph usually includes a side-by-side comparison of all these methods. In addition, if the stock is publicly traded, the 52-week trading range and the valuation range from available equity research reports are added to the graph.
The graph is commonly used in valuation reports, investment banking pitch books, and fairness opinions.
- A football field graph summarizes a range of values.
- The graph is widely used to compare the results of different valuation methodologies when applied to any given asset or business.
- In the finance world, it is used by business and asset valuators, investment bankers, and any other financial professionals who have a goal of summarizing comparable values derived by using different approaches.
- A field graph could be constructed with the help of clustered bar charts and stacked bar charts in Excel.
- A clustered bar chart is a chart that displays more than one data series in clustered horizontal columns.
- A stacked bar chart is a chart that shows the composition and comparison of a few variables over time.
Understanding football field graph
Regarding valuations, the overall result matters more than the result obtained using any single valuation method. It is helpful to get a view of everything at once, and that is when this field graph comes in handy.
The football field graph is a floating bar chart in Excel. Its purpose is to create a visual representation of the valuation methods used. The ultimate goal is to show a valuation range based on those methods.
Note
One of the goals of the graph is to check various methods against one another.
If the company looks undervalued across all ranges and all methodologies, it probably is, and vice versa, for overvalued results. In most cases, however, the results will be mixed.
For example, the DCF valuation method might yield lower valuation results when compared to comparable company analysis, which could be the case during solid equity markets.
The graph allows us to see the alternative valuation methods when arriving at a valuation range.

How to make a field graph in Excel?
There are multiple ways to build a football field graph in Excel. Some of the standard methods involve clustered bar charts and stacked bar charts.
A clustered bar chart is a chart that displays more than one data series in clustered horizontal columns. A stacked bar chart is a chart that shows the composition and comparison of a few variables over time.
Whichever method you use, remember that constructing a clustered bar chart or stacked bar chart is just the first step in the process. Next, both charts must be amended to resemble a regular field graph.
Clustered bar chart
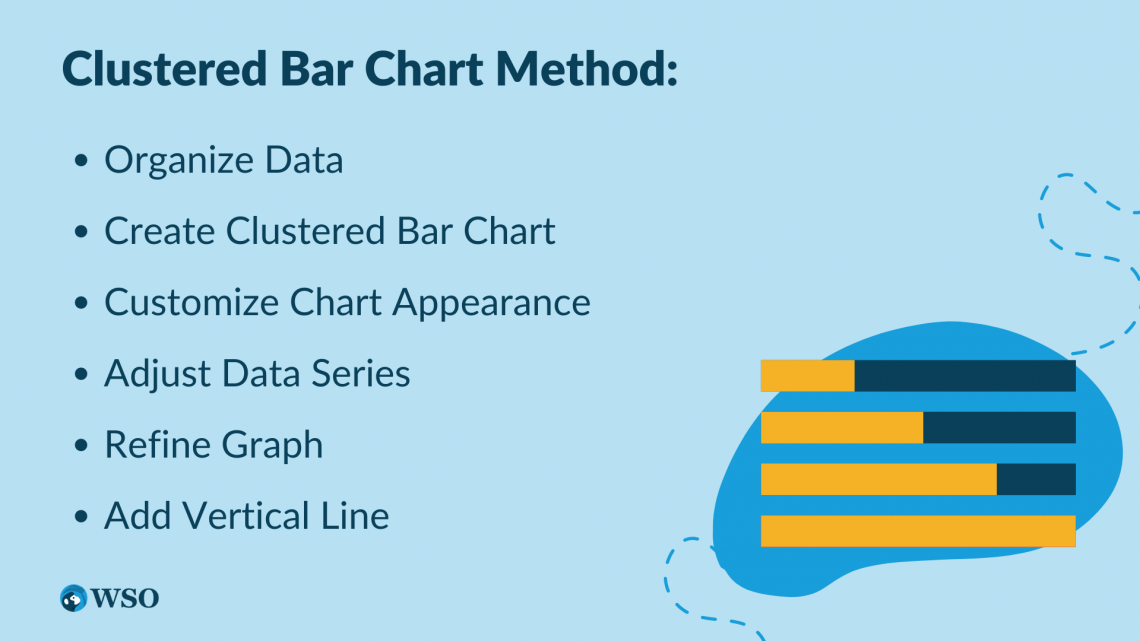
One of the ways to create a football field graph is through the use of a clustered bar chart. Step-by-step instruction on creating and adjusting the chart to get the desired outcome is provided below.
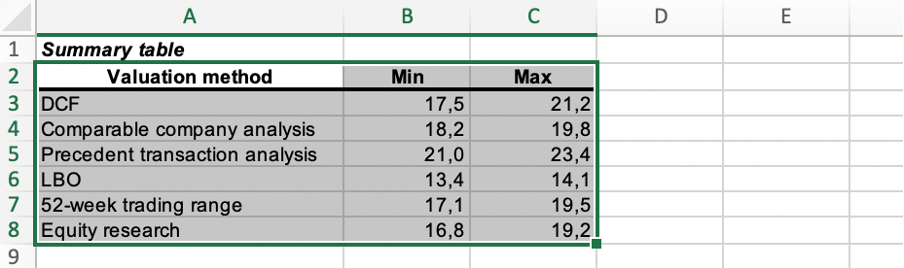
1. Start by organizing the data
The stock price ranges used in building the graph are summarized below. The stock price ranges were obtained using different valuation methods.
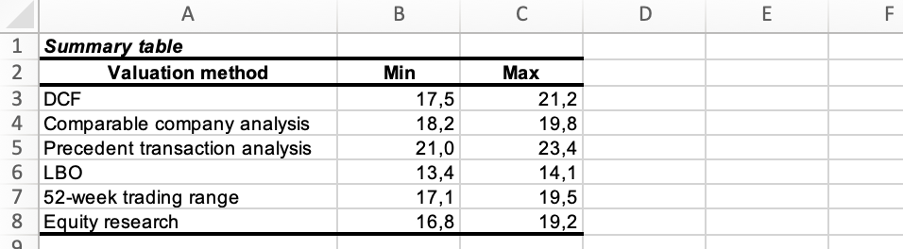
Alternatively, one can build a graph based on the enterprise value ranges or other valuation metrics.
2. Create a clustered bar chart.
First, select the data from the table, including the headers:
Then click on the Insert tab from the ribbon and insert the Clustered Bar. The location of the Clustered Bar option depends on the Excel version you are using.
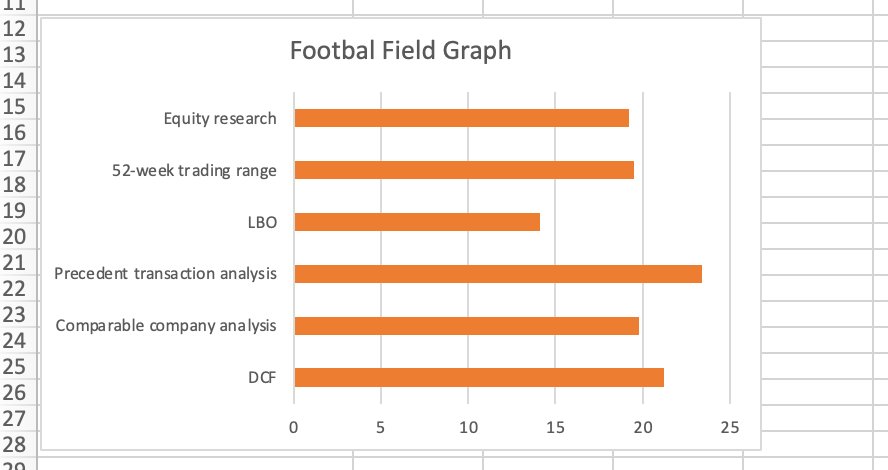
Once you form the Clustered Bar, the graph pop-ups:
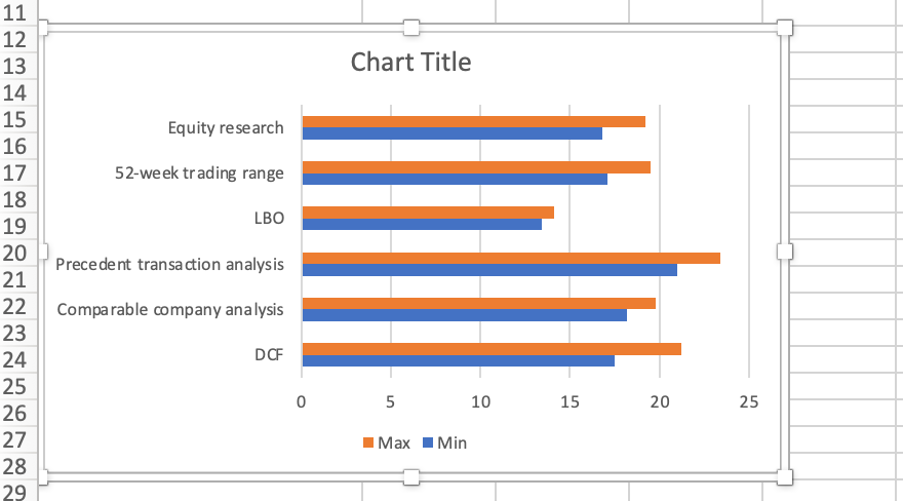
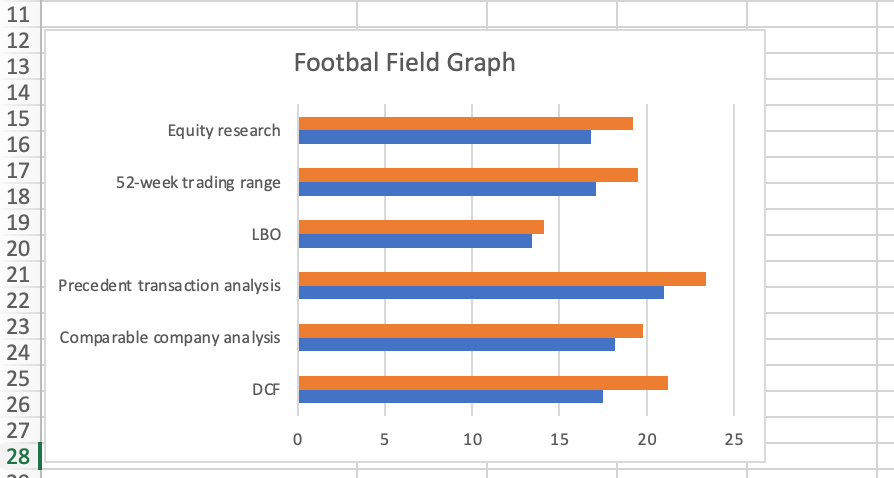
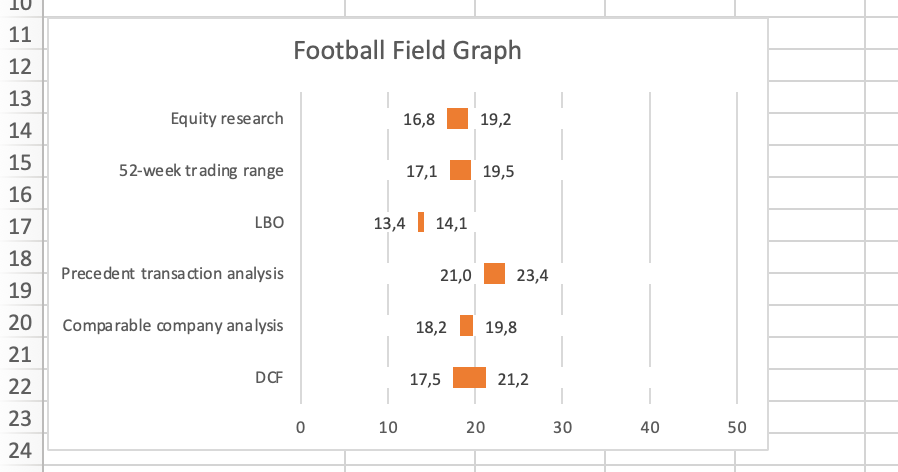
To make your graph more presentable, remove the legend (Max, Min on the graph) and the amendment of the Chart Title:
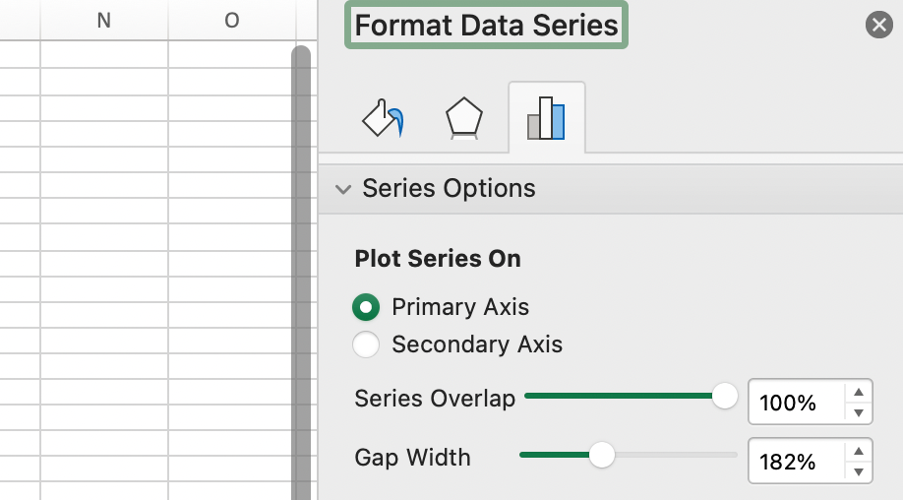
Now you can format the data series. Select the orange bars, right-click on the selected bars, and press Format Data Series.
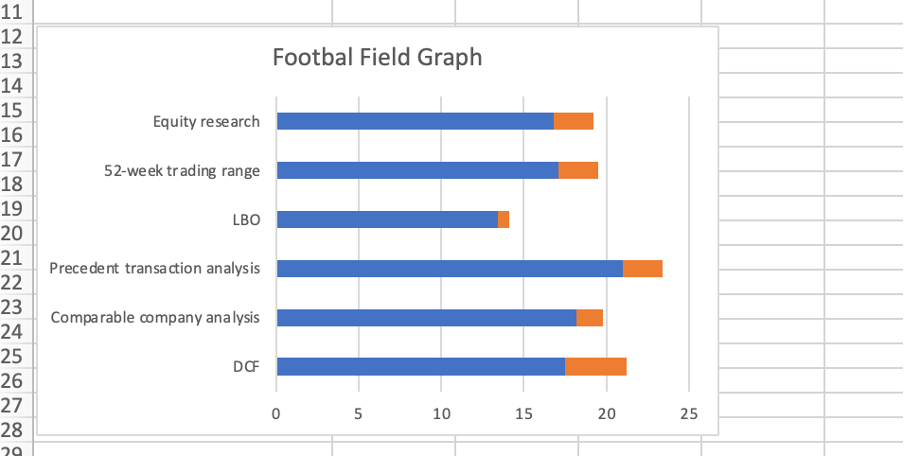
Under Series Options, change the Series Overlap to 100%:
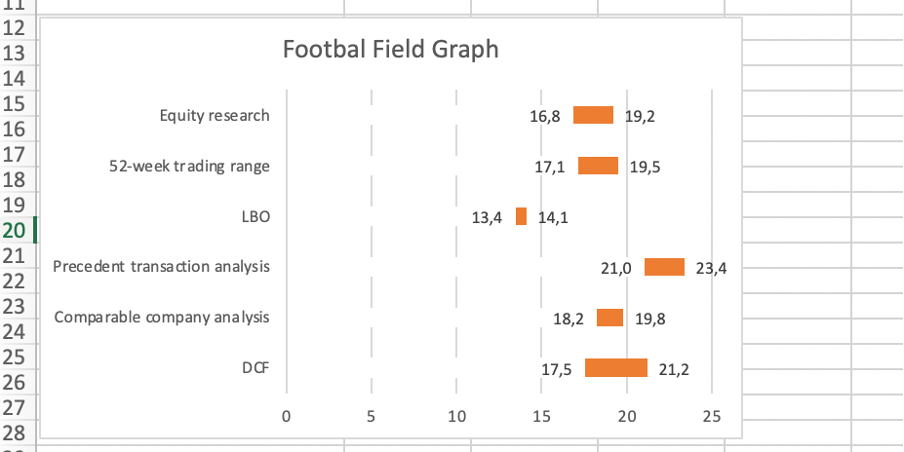
At this point, your graph will look as in the image below:
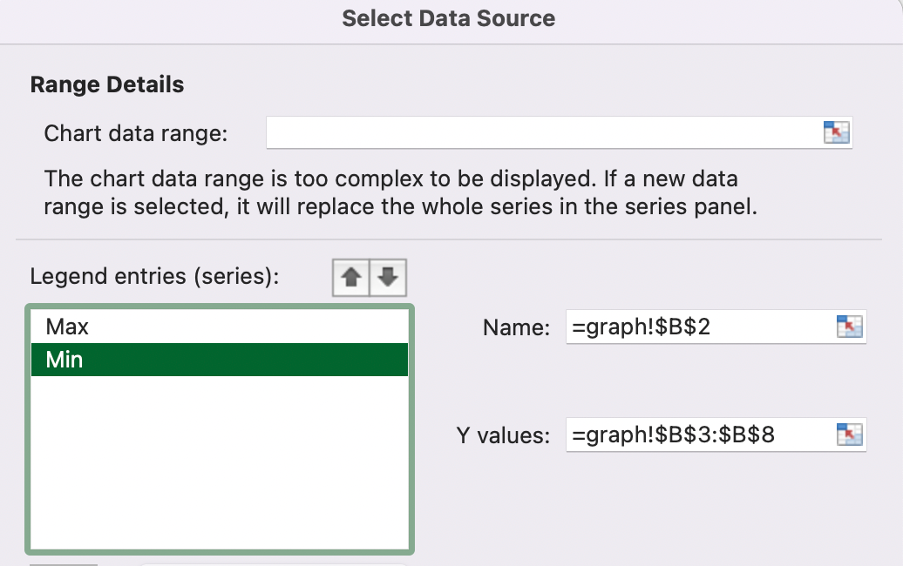
Right-click on any bar to select the series and choose Select Data Source. Next, select Min and move it down by clicking on the down arrow:
After performing the steps above, you will get the following:
Right-click on one of the blue bars to select the series and choose Format Data Series. Next, select the white color as a Fill and the Outline:
Click on the series colored white and select Chart Design from the ribbon, followed by Add Chart Element, Data Labels, and Inside End. Follow by clicking on the series colored orange and selecting Add Data Labels:
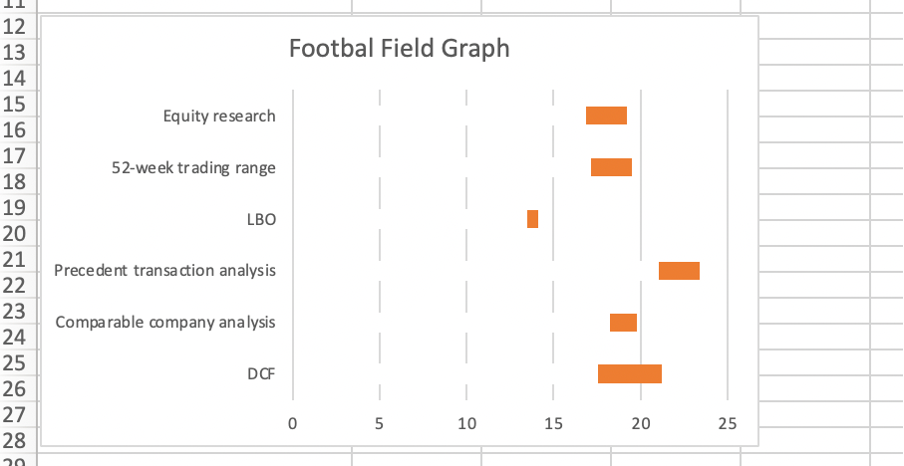
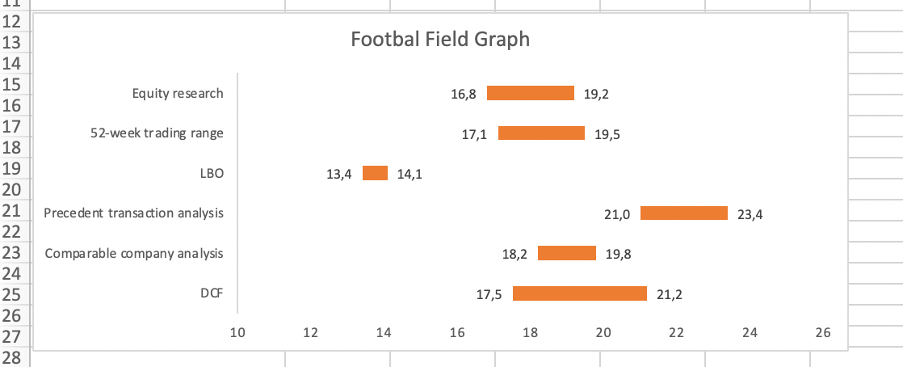
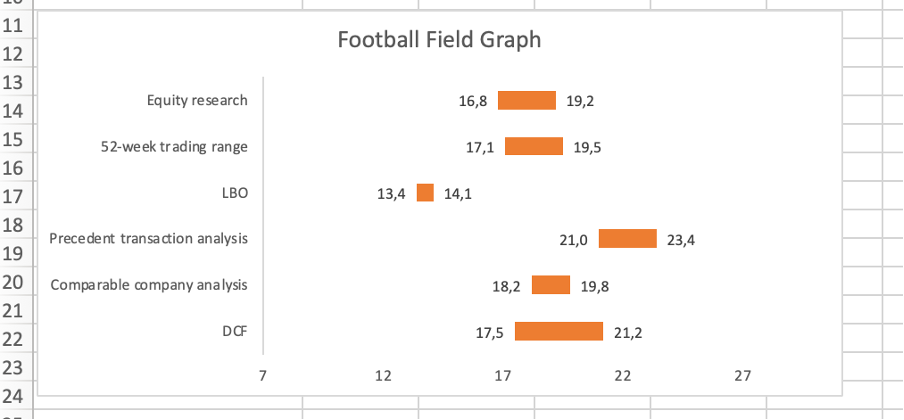
Remove the vertical gridlines by clicking on them and hitting the delete key. If you want to change the X-Axis, right-click on the X-Axis labels and select Format Axis. Change the parameters as you see fit.
You might also want to expand the chart to the right to stretch the valuation ranges:
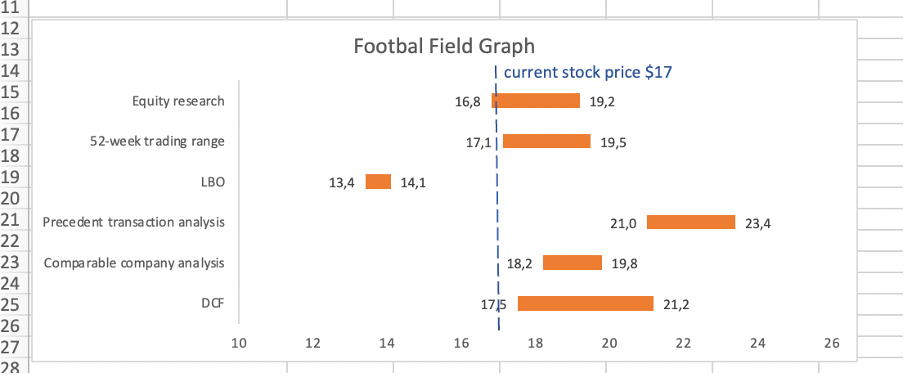
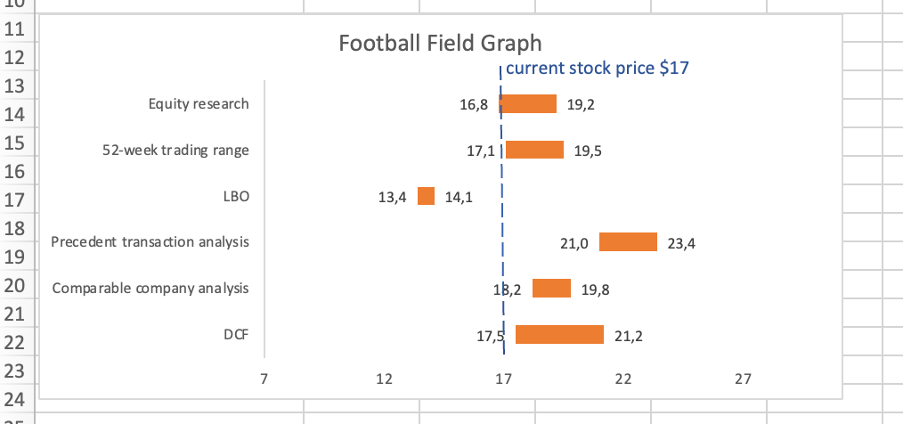
3. Add a vertical line for the current market price.
Click on the Insert menu, select Shapes, and then the Line. Next, draw a vertical line on the chart, positioning it where relevant. In addition, insert Text to specify what the line means.
Stacked bar chart
Alternatively, a stacked bar chart can create a football field graph. Step-by-step instruction on creating and adjusting the chart to get the desired outcome is provided below.
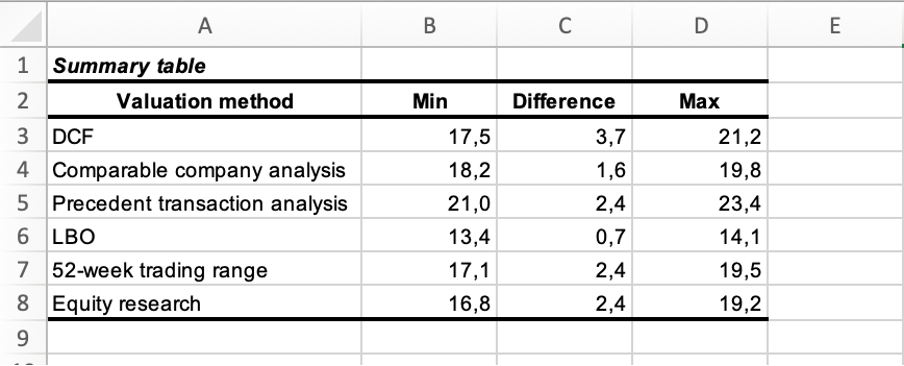
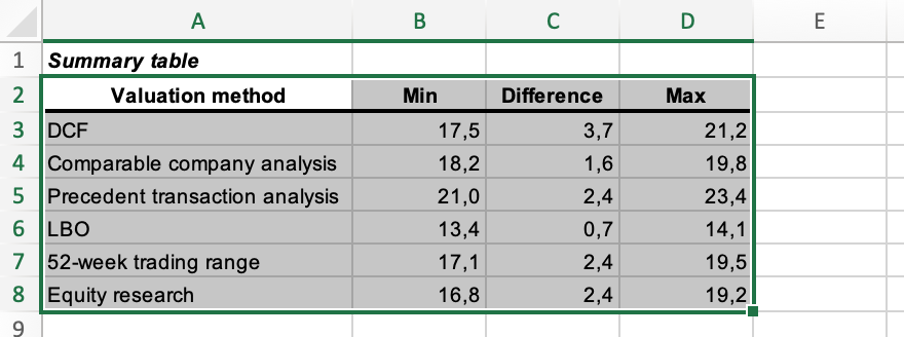
1. Start by organizing the data.
The difference column is added and calculated as the difference between the maximum and minimum values.
2. Create a stacked bar chart.
Select the data from the table, including the headers.
Click the Insert tab from the ribbon and insert the Stacked Bar. The location of the Stacked Bar option depends on the Excel version you are using.
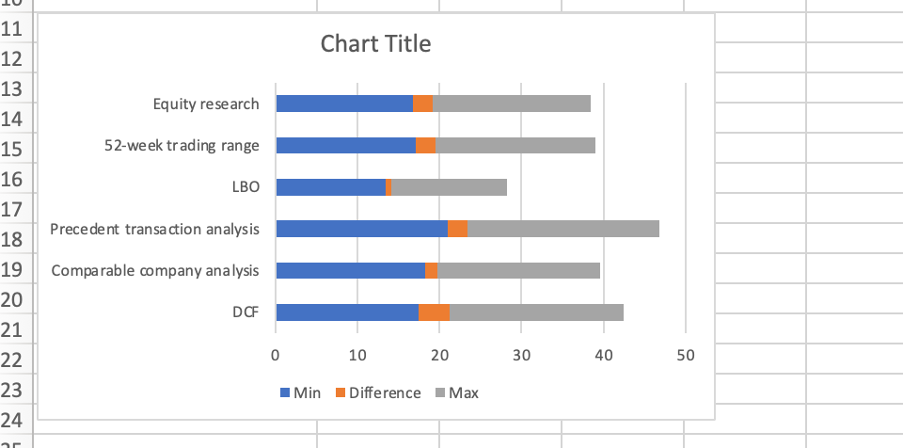
To make your graph more presentable, proceed with the removal of the legend (Max, Min, Difference on the graph) and the amendment of the Chart Title:
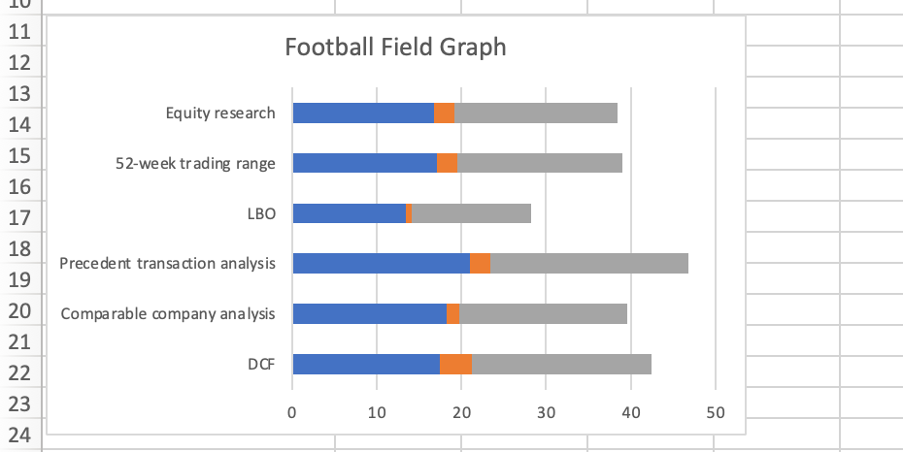
Click on the series colored blue and select Chart Design from the ribbon, followed by Add Chart Element, Data Labels, and Inside End. Follow by clicking on the series colored gray, then Data Labels, and then Inside Base:
Right-click on one of the blue bars to select the series and choose Format Data Series. Select white color as a Fill (alternatively, No fill option can be chosen) and the Outline. Repeat the same steps for the gray bars:
If you select white color, fill in the previous step and remove the vertical gridlines by clicking on them and hitting the delete key. Removing the vertical gridlines is unnecessary if you select the No fill option.
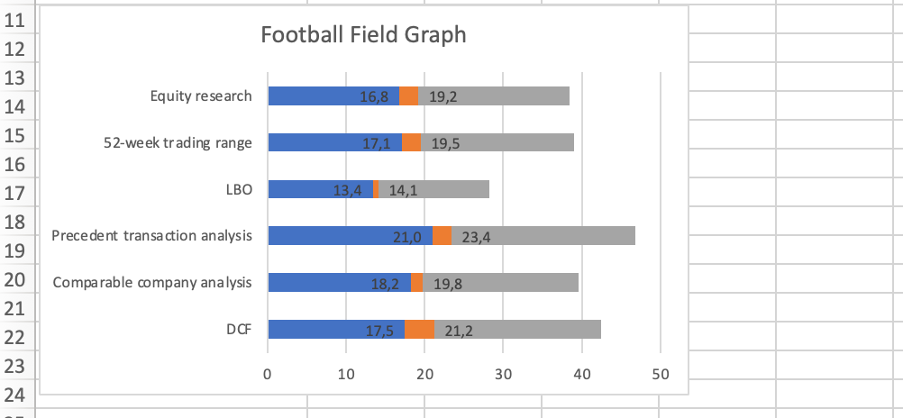
If you want to change the X-Axis, right-click on the X-Axis labels and select Format Axis. Change the parameters as you see fit. You might also want to expand the chart to the right to stretch the valuation ranges:
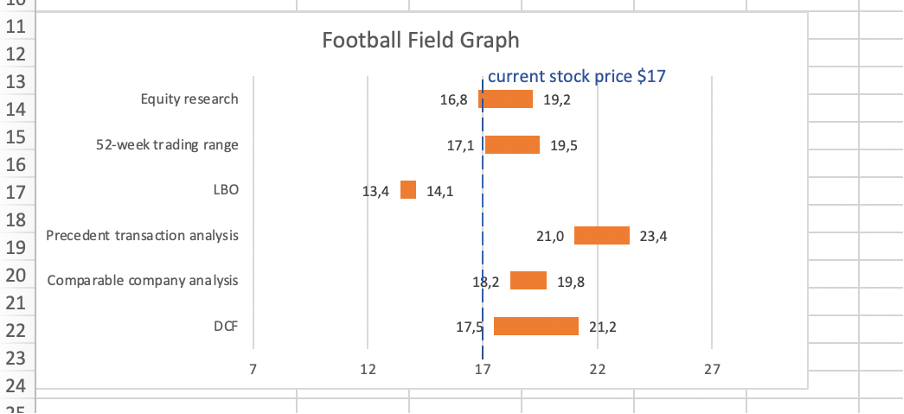
3. Add a vertical line for the current market price.
Click on the Insert menu, select Shapes, and then the Line. Draw a vertical line on the chart, positioning it where relevant. In addition, insert Text to specify what the line means.
Alternatively, choose to keep the vertical gridlines. The final graph will look as follows:


or Want to Sign up with your social account?