How to trade level breakouts without risks
Level breakouts are a widely recognized concept in technical analysis; even beginner traders are familiar with them. However, this strategy does not always work correctly in practice: there is a risk of buying highs and selling lows, as many level breakout signals are false.
In this practical article, we will try to give traders more confidence when trading breakouts. The volume analysis indicators available on the ATAS trading and analytical platform will help with this. Volume analysis will make the market as transparent as possible when assessing a level breakout.
WHAT LEVEL BREAKOUT TRADING IS BASED ON
Breakout trading is an approach in which a trader focuses on price movements through key support or resistance levels. The strategy is based on the assumption that if the price breaks through a support or resistance level, there is a possibility that the price will continue moving in the same direction.
A level building can be quite subjective. Different guidelines are used for this:
- previous extremum points;
- psychological meanings of prices;
- patterns of technical analysis;
indicator values (for example, high volume levels on the market profile).
Levels can be inclined and horizontal, they can use a different number of guidelines. In general, trading on a breakout of a support level looks like this:
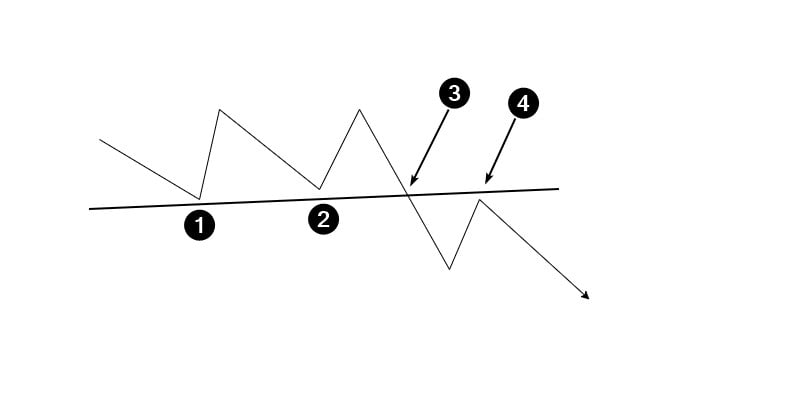
The diagram shows:
- 1 and 2 — local lows for building support;
- 3 — a bearish breakout of the support level;
- 4 — a breakout test (it is not always formed).
The opposite is true for a bullish breakout of a resistance level.
IDEA OF THE PATTERN
The idea of a breakout is to disrupt the balance of supply and demand.
Suppose that in the market, the forces of buyers and sellers were balancing each other out for a period of time. At the same time, the price was forming a trading range (was flat). The boundaries of a formed range (or a technical analysis pattern) usually define support and resistance levels.
Let’s continue to develop the hypothesis. Under the influence of some negative factors, buyers weakened, sellers became more active, and the price began to fall. At the same time, there was a breakout of the support line — market participants reached a consensus that the price for the asset is too high, and the fair price is lower. At this moment, sellers become very active, which leads to a breakout.
HOW TO IDENTIFY A BREAKOUT USING VOLUME INDICATORS
Experienced traders may notice that:
- when the price is about to break through a level, the trading volume usually increases as it approaches that level;
- before a true breakout occurs, there is usually a false breakout (a deceptive maneuver) in the opposite direction;
- breakouts occur rapidly, leaving little time for traders to analyze and enter a position at a bargain price. Moreover, opening a trade in the direction of a breakout, a trader may feel emotional discomfort due to the potential of buying at a high price or selling at a low one.
How to confirm a breakout to trade more confidently?
Look for clear evidence of one party’s dominance over the other. It can be found using advanced volume analysis indicators of the ATAS platform. For example:
- Stacked Imbalances shows the dominance (imbalance) of one of the parties by analyzing several price values in a row. The imbalance usually occurs in the breakout area. This indicator can also be used for money management, as will be shown below.
- Speed of Tape in delta mode will give evidence of increasing pressure of one of the parties over time.
The cluster chart below illustrates a breakout of the resistance level.
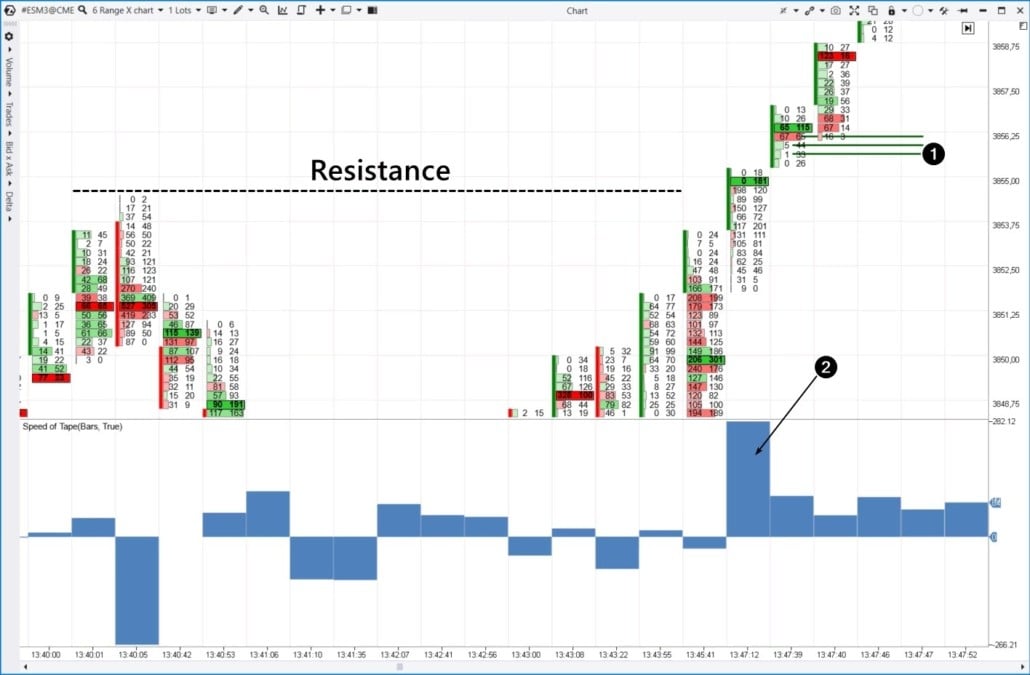
The numbers indicate:
- Dominance of buyers over sellers (1), which is noticeable by the difference between bought (in the right column) and sold (in the left column) contracts at several price values. The green bars of the Stacked Imbalances indicator show this situation.
- Trade execution speed (2). The Speed of Tape indicator is a unique development of ATAS programmers. It does not follow a theoretical formula, but it can be a valuable instrument in practice.
Let’s have a look at how different indicators behave during breakouts on charts of various instruments. We have chosen Range X charts — if the breakout occurs quickly, standard time frames may receive indicator signals with a delay. The Range X chart allows you to compensate for this nuance.
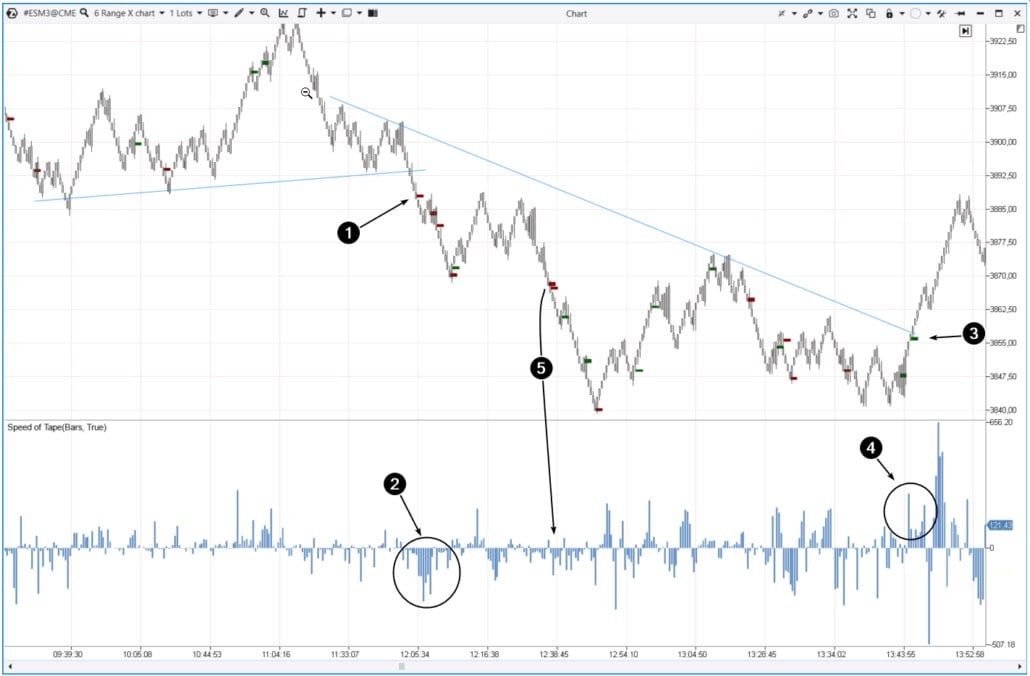
S&P-500 Example 1. Futures on the S&P-500 index
The Stacked Imbalances indicator allows you to look for imbalances between buyers and sellers without looking inside the candles. This allows you to control the bigger picture, evaluate the interaction of price and indicator signals.
More examples for Euro futures and cryptocurrency you can be found in the article "How to trade level breakouts without risks" on our website.


Sit quas doloremque adipisci ut assumenda dolor. Ut qui quis perspiciatis dolorem doloremque. Qui voluptas molestias similique repellendus quia.
Deserunt dolore at repellendus dolor rerum. Qui ab temporibus repudiandae a dicta esse corporis. Voluptatem modi quo eum ipsa.
Sunt sed vel hic. Ad architecto qui veritatis facere. Quia possimus et optio aut ratione illo porro.
Saepe et pariatur consequatur sequi consequatur. Facere veniam nam molestias. Et quia saepe recusandae ab dignissimos.
See All Comments - 100% Free
WSO depends on everyone being able to pitch in when they know something. Unlock with your email and get bonus: 6 financial modeling lessons free ($199 value)
or Unlock with your social account...