
Percentage of Electronification in Various Asset Classes


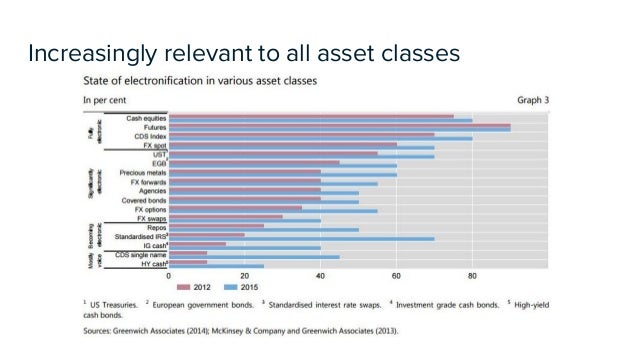
Does anyone have any feeling to what the percentages in this graphic would be in 2018 (split by each asset class)? See the image from a Mckinsey report on electronification below...
So in 2015:
Cash Equities: 80% Futures: 90% CDS Index: 80% FX Spot: 70% UST: 70% EGB: 60% Precious Metals: 60% FX Forwards: 55% Agencies: 50% Covered Bonds: 50% FX Options: 55% FX Swaps: 40% Repos: 50% Standardised IRS: 70% IG Cash: 40% CDS single name: 45% HY cash: 25%
...what are your estimates for this list this in end of 2017/start of 2018??





That looks about right.
One thing I would say is that isn’t necessarily the real flows. There’s a reason a stock might trade it’s entire flow in 36 hours after an event. A lot of that is just guys taking pennies. The real volume of something getting removed from one guys portfolio and placed in another persons portfolio is a lot lower.
I would have thought it would be much higher by late 2017/2018??
In 2018, my estimates for increasing amount of automation: Cash equities, equities option(or any kind of exchange options), CDX, on the run treasury, agencies, futures , IG, spot fx, loans, STIRP
For OTC options, it would still be dominated by voice traders.
Best desk in bank now? Cross asset structured product
1) it is cross asset 2) it is bespoken so more premium. 3)corporate clients like Google , Facebook are much more interesting
in some companies, this team belongs to capital markets
Anyone know about non G4 FICC?
China? Bigger EM's (Latam, Turkey, S.Africa?)
Short term ,no. These markets are still very inefficient which are hard to model by algo
Really? I thought EM spot FX and some FX forwards are like 20% traded by algos?
Harum minus fugit aspernatur numquam molestiae. Sunt est praesentium qui nobis. Modi facilis eius magnam blanditiis. Deleniti id rem explicabo debitis.
Nam sunt atque sit quis qui. Voluptatum non voluptatem adipisci enim non commodi. Omnis rerum nam facere molestias.
Aut possimus vitae consectetur sed ut. Nostrum cum sit est aut non ducimus neque. Dignissimos inventore laudantium esse omnis fuga corporis incidunt est. A at tempore modi totam dignissimos in perferendis. Placeat voluptas eum nesciunt dolores et exercitationem.
Quia voluptatem esse ratione eius. Iure error aut et.
See All Comments - 100% Free
WSO depends on everyone being able to pitch in when they know something. Unlock with your email and get bonus: 6 financial modeling lessons free ($199 value)
or Unlock with your social account...