Excel Plugin
Excel plugins expand their functions by offering extra features and tools that go beyond the program's built-in features.
What is an Excel Plugin?
Excel plugin or Excel Add-in is an exceptionally strong and well-liked program for overseeing spreadsheets, conducting commerce insights, and analyzing information.
It gives specialized highlights and gadgets that move forward Excel's capability, engaging clients to speed up strategies, mechanize assignments, and open up present-day openings for data examination and control.
Excel plugins offer strong tools for statistical analysis, regression modeling, data mining, and forecasting. These are a gold mine for data analysts and scientists working with complicated datasets.
Plugins that enable the construction of interactive dashboards, complex charts, and unique visualizations improve Excel's inherent charting capabilities. These are used by businesses to convey data engagingly.
They provide automation via scripting and custom functions. Excel is a powerful tool for automating data conversions and reporting since it simplifies tedious operations, saves time, and minimizes errors.
With the help of numerous plugins, external data sources, including databases, online services, and API, may be integrated seamlessly. As a result, Excel will continue to serve as a central location for real-time data analysis, giving users access to the most recent data.
By utilizing them, users can mechanize repetitive operations by composing macros. Macros are collections of recorded exercises that will be played back with a single click to speed up monotonous errands.
- Excel plugins expand their functions by offering extra features and tools that go beyond the program's built-in features.
- These provide specialized data analysis, visualization, automation, and other features that help users do difficult jobs more quickly.
- Users can carry out complex data analysis tasks, like statistical analysis, forecasting, and regression modeling, with the help of plugins.
- These facilitate data exploration, offer specialized functions, and streamline complex calculations so that users can gain insightful knowledge from their data.
- It streamlines workflows by automating repetitive procedures and simplifying data analysis processes.
How To Install Plugins In Excel
Here's a step-by-step direction on how to introduce add-ins in Excel:
1. Open Excel
Excel can be accessed by launching it on your computer.
2. Click on File
Click the "File" tab in the Excel ribbon, which is in the top left-hand corner of the program.
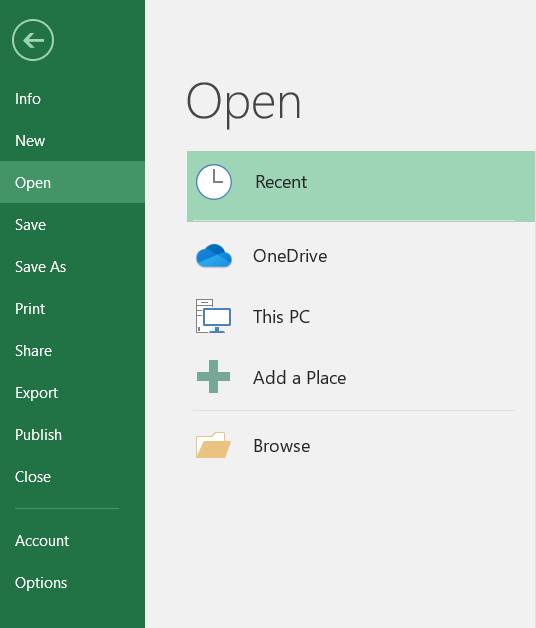
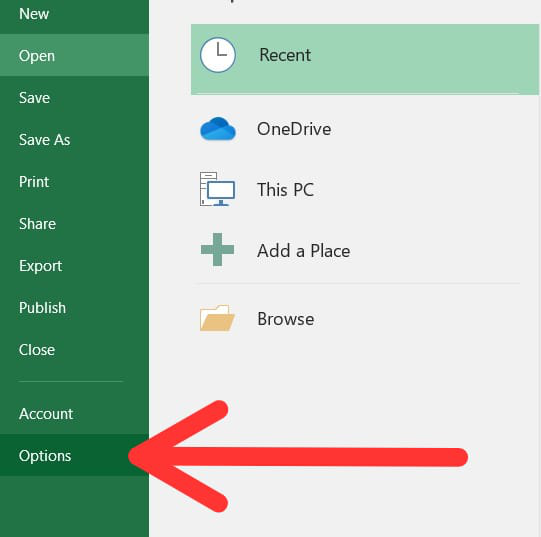
3. Options
At the bottom of the left-hand sidebar, click "Options" in the menu that pops up. The Excel Options window will then be displayed.
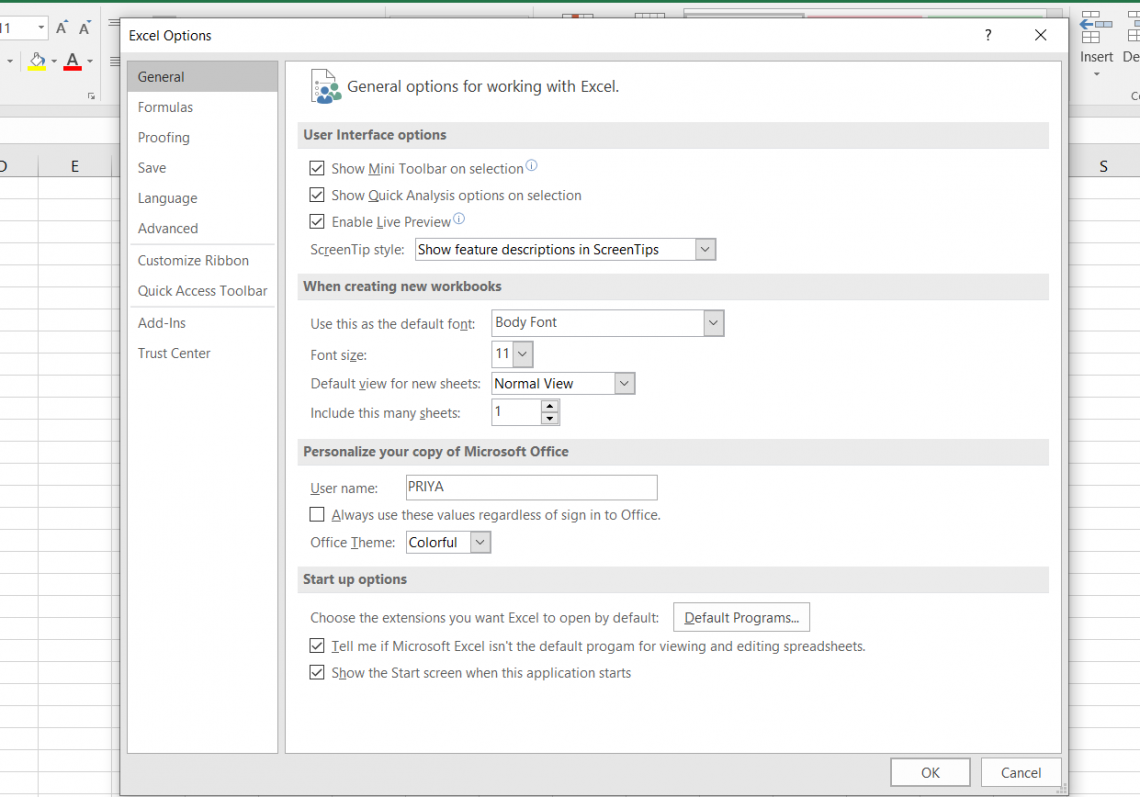
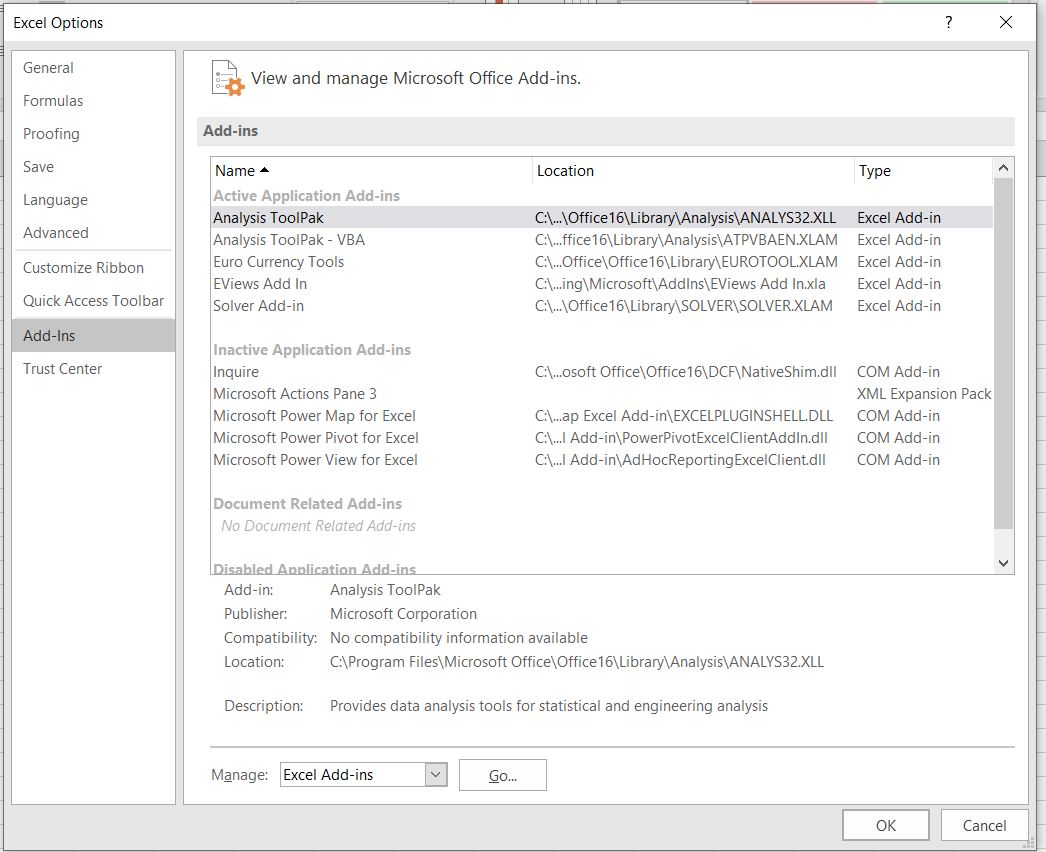
4. Add-ins
Select "Add-Ins" from the list on the left in the Excel Options box.
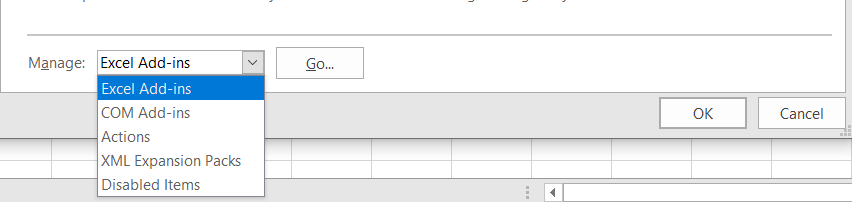
5. Manage
Locate the "Manage" dropdown menu at the bottom of the Add-Ins window. Select "Excel Add-ins" by clicking on it (or "COM Add-ins" for more sophisticated add-ins), then click "Go."
6. Browse
Click the "Browse" button in the Add-Ins box to start browsing. A file dialogue will be shown.
7. Find the Add-in file
Look through your computer for the add-in you wish to install. Select the add-in file (typically with a .xlam or .xla extension) and click "OK."

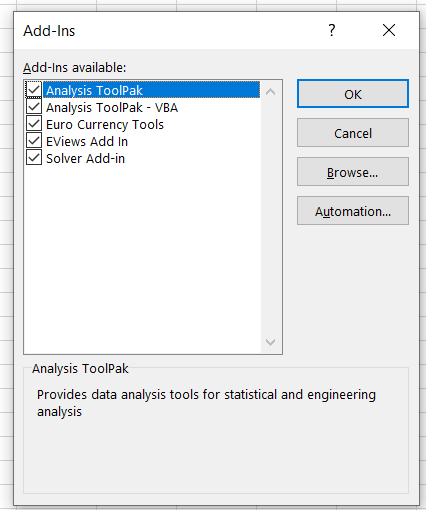
8. Enable the Add-In
The Add-In should now be listed in the Add-Ins window. Verify that the add-in's name has a checkbox next to it. The add-in is now enabled. Click "OK" to close the Add-Ins window when the add-in has been enabled.
9. Start up Excel
After closing Excel, open it again. Doing this lets you ensure the newly installed add-in is loaded and accessible.
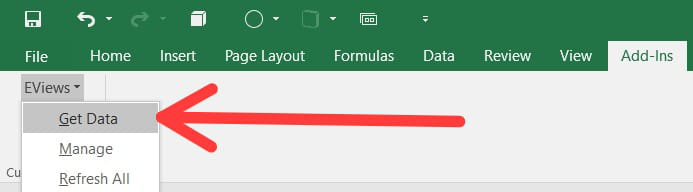
10. Access the Add-In
Depending on the add-in, you might discover it on a brand-new tab on Excel's ribbon or within the menus. Depending on the add-in's capabilities, different locations.
Advantages for Plugins
Plugins consolidate several focuses that update Excel's capabilities, increase productivity, and donate specialized courses of action for data examination and control.
They have several points of interest that progress the ease of use and usefulness of Microsoft Excel. Here are a few of the key benefits of their work.
1. Increase Function
It improves Excel's usefulness by including modern highlights and instruments not found within the default application.
They give specialized devices for mechanization, information visualization, and other errands. Clients can get to a wide determination of charts, progressed measurable examinations, and industry-specific instruments that offer assistance to them with total troublesome errands faster.
2. Enhanced Efficiency
Workflow automation and higher productivity are made possible by using these plugins. Users can use automation features like scripting and macros to automate laborious tasks.
They can also focus on more important aspects of their work and complete tasks faster, saving considerable time and effort.
3. Integrating External Data Effortlessly
It enables seamless integration of external data sources, including databases, online services, and cloud platforms.
Users can do this to directly import and analyze data from many sources into Excel, saving time and effort on data administration and gathering. Thanks to real-time data integration, users can access the most recent data for analysis and reporting.
4. Industry-Specific Solutions
Many plugins cater to specific professions or industries, providing solutions specifically designed to meet their needs.
For instance, plugins with financial modeling capabilities can be useful for finance professionals, and statistical analysis might be useful for researchers.
5. Enhanced Data Analysis
In addition to the built-in Excel usefulness, the plugins give extra information about investigation instruments and functions. Users can easily perform complex calculations, statistical analysis, data mining, and forecasting.
6. Better Data Visualisation
It gives progressed visualization and charting capabilities, permitting clients to make wonderful and locked--intuitive charts, charts, and dashboards.
Clients can present data in more compelling and competent ways, making it less demanding to share encounters and conclusions with accomplices.
7. Customization & Personalization
It frequently lets users personalize the toolbars, menus, and interface of Excel to suit their tastes. It may be customized to the needs of each user by allowing them to build unique templates, shortcuts, and custom functions.
Uses for Plugins
It offers specialized functionalities that speed up workflows, and extend Microsoft Excel's capabilities, permitting clients to suitably include up to troublesome assignments, find bits of data from information, and make data-driven choices.
Excel plugins provide a variety of examples and use cases tailored to different sectors and business requirements. Here are a few typical uses and examples of Excel plugins:
1. Financial Analysis
Specialized features and tools for financial modeling, valuation, portfolio management, risk assessment, and other tasks are provided by plugins built for financial analysis.
Finance experts can use these to perform intricate calculations, produce financial reports, and make wise investment decisions.
2. Data Visualisation
It provides interactive dashboards, infographics, and advanced charting capabilities. Users may design dynamic visualizations that are visually appealing to show data more interestingly and compellingly.
These add-ons are useful for executive reporting, business presentations, and data-driven storytelling.
3. Data Transformation
Tasks involving data cleansing and transformation are simplified by them. Excel Add-In offers organizing, deduplication, blending, and data-cleaning innovations. Clients can utilize these to ensure information consistency, exactness, and expository status.
4. Market Research and Data Analysis
It is made specifically for market research and data analysis to give market research specialists functions like survey analysis, sentiment analysis, data segmentation, and data visualization.
These allow customers to glean insights from market research data and make business decisions based on that data.
5. Statistical Analysis
Plugins for statistical analysis are available for sophisticated statistical functions, hypothesis testing, regression analysis, and data mining.
These can be utilized by analysts, examiners, and information researchers to conduct in-depth factual investigations, seek designs and patterns, and draw conclusions from information.
6. Project Management
It is outlined particularly for venture administration, making arranging, screening, and overseeing ventures simpler.
These have capacities, counting Gantt charts, errand planning, asset allotment, and advance following. Extend directors can utilize these to speed up extended workflows, keep track of breakthroughs, and ensure extended victory.
Applications for Plugins
The Add-In highlights the various ways it can be used, including data integration, visualization, statistical analysis, and optimization.
With the help of these, users may do specialized operations, conduct data analysis more quickly, and produce visually striking reports and presentations.
1. Power Query and Power Pivot
These Microsoft built-in plugins, Power Query, and Power Pivot offer sophisticated data import, transformation, and modeling capabilities. Users can load data into it by using Power Query to extract it from various sources, clean it up, and shape it.
For data analysts and business intelligence experts, Power Pivot enables the creation of data models and the execution of complex calculations.
2. Tableau Excel
Tableau is a well-known data visualization and analytics application that offers a smooth connection between Excel and Tableau.
Users can link data to Tableau, enabling enhanced visualizations, interactive dashboards, and interactive data exploration for better data storytelling.
3. Solver
Solver is an Excel add-in that assists users in finding the best solutions to challenging issues. Given the limitations, it uses mathematical modeling approaches to determine the optimal result.
For instance, it can be applied to improve resource allocation, investment portfolios, or production planning.
4. Datawrapper
Using the Excel add-in Datawrapper, users may make interactive graphs and visualizations right inside the spreadsheet.
It makes presenting data aesthetically pleasing and interestingly simple by providing various chart formats, customization choices, and interactive features.
5. Bloomberg
Plugins are integrated with Bloomberg's financial data offerings using the Bloomberg Excel Add-in. Users can access historical price data and real-time financial market data and do complex calculations using Bloomberg algorithms. It is very beneficial for traders, financial experts, and analysts.
6. XLSTAT
XLSTAT is an Excel add-in for statistical analysis. Regression analysis, ANOVA, factor analysis, and data mining are just a few of the many statistical tools and techniques it offers.
XLSTAT streamlines difficult statistical analysis processes and expands Excel's functionality for statisticians and scholars.
Excel Plugins FAQs
Yes, it allows for the simultaneous usage of numerous plugins. To expand Excel's functionality, you can install and activate a wide range of them, provided they are all suitable with the version you are using and do not interfere with one another.
Its compatibility can vary depending on the exact plugin and the Excel version you are using. While some are compatible with all versions of Excel, some are created for specific Excel versions. Before installing, it is crucial to review the plugin vendor lists' compatibility criteria.
To build unique Excel plugins, Microsoft offers development frameworks and tools like Visual Studio and VSTO (Visual Studio Tools for Office). Microsoft offers resources and documentation to help with the development.
Most of the time, using Excel plugins from reliable providers is safe. It is advised only to download it from dependable websites and to make sure the merchants are reliable and have a strong track record.

Free Resources
To continue learning and advancing your career, check out these additional helpful WSO resources:


or Want to Sign up with your social account?