COVARIANCE Function
A statistical function that returns covariance for the entire population.

What is the Covariance Excel Function?
Covariance measures the joint variability of two random data sets. Based on the nature of the relationship, it can be positive, negative, or zero. The covariance can be calculated either by using a mathematical formula or Excel.

There are two covariance functions in Excel - COVARIANCE.P, and COVARIANCE.S.
COVARIANCE.P function returns population covariance (calculated over the entire data set), while COVARIANCE.S function returns sample covariance (calculated over a sample). The functions fall under the statistical functions category.
Both functions replaced the COVAR function as they provide improved accuracy, and their names better reflect their usage. At the same time, the COVAR function is still available in the latest Excel version, so one can use it for comparability with Excel 2007 and earlier versions.
Covariance is widely used in the fields of science, such as biology and micrometeorology. It is considered significant in finance and modern portfolio theory.
- Covariance is a statistical tool that evaluates to what extent and how much the mean values of two variables move together.
- The measure could be positive, negative, or equal to zero.
- There are two types of covariance – sample and population. Both could be easily calculated in excel using COVARIANCE.S and COVARIANCE.P functions.
- Covariance has significant applications in finance, namely in CAPM and modern portfolio theory.
Covariance Explained
Covariance defines the relationship between the two data sets. In other words, it evaluates to what extent and how much the mean values of two data sets move together. However, it does not measure the dependency between those data sets.

If you need to understand two data sets' direction and strength, you should use the correlation.
Covariance could be:
- Positive: Occurs when two random data sets move in the same direction (simultaneous increase/decrease in value of two data sets).
- Negative: Occurs when two random data sets are moving in the opposite direction (the decrease/increase in the value of another data set accompanies an increase/decrease in the value of one data set).
- Zero: Occurs when the values of two random data sets do not vary together.
1. Population Covariance
This formula is useful when working with huge data sets—for example, stocks (given the historical data).
The formula for calculating population covariance between X and Y data sets is as follows:
Cov (X, Y) = [Σ(Xi - µ) (Yj - v)]/ n
Where the parts of the equation are:
- Xi – data value of X
- μ – mean value of X
- Yj – data value of Y
- ν – mean value of Y
- n – number of data values
In Excel, the COVARIANCE.P function returns the equivalent result.
2. Sample Covariance
When a population is too large, one may refer to samples to analyze the data sets.
The formula for calculating sample covariance between X and Y data sets is as follows:
Cov (X, Y) = [Σ(Xi - µ) (Yj - v)]/ n - 1
Where the parts of the equation are:
- Xi – data value of X
- μ – mean value of X
- Yj – data value of Y
- ν – mean value of Y
- n – number of data values
In Excel, the COVARIANCE.S function returns the equivalent result.
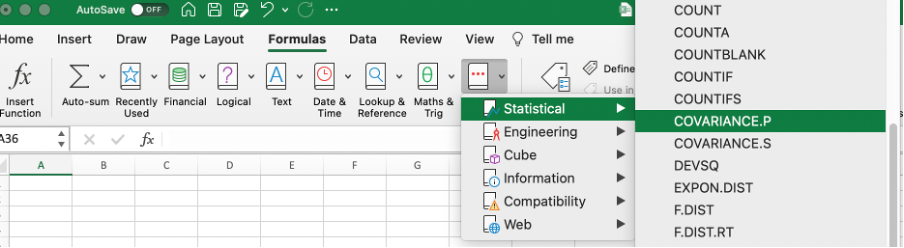
COVARIANCE.P function
It is a statistical function that returns covariance for the entire population. It can be found in Excel under the Formulas tab.
The formula for the COVARIANCE.P function is:
=COVARIANCE.P(array1;array2)
The function uses the following arguments:
- Array1: The first cell range of integers, and must be numbers, arrays, or references containing numbers.
- Array2: The second cell range of integers, and must be numbers, arrays, or references containing numbers.
Things to consider when using the function:
- The formula considers only the arguments that are either numbers or names, arrays, or references that include numbers; all other values are ignored.
- The arguments must have the same number of data points; otherwise, the function returns the #N/A Error value.
- To ensure that the function does not return the #DIV/0! Error value, the arguments should not be empty.
NOTE
The function shouldn’t be used when the population standard deviations are unknown.
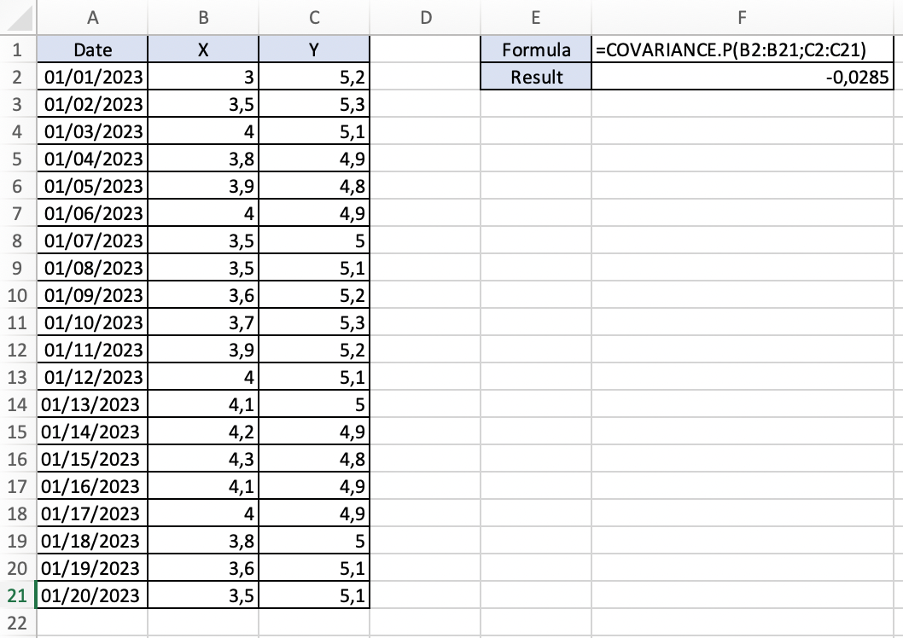
Example for the COVARIANCE.P function
Let's consider the share prices of two companies, X and Y, for 20 days.
Array 1 (data in cells B2:B21) represents the share prices of company X.
Array 2 (data in cells C2:C21) represents the share prices of company Y.
The goal is to understand the relationship between companies X and Y's share prices if any.
As we can see from the calculation below, the result returned by the formula is negative 0,0285, indicating a negative covariance between the share prices of the two companies (when the share prices of company X go up, the share prices of company Y go down).
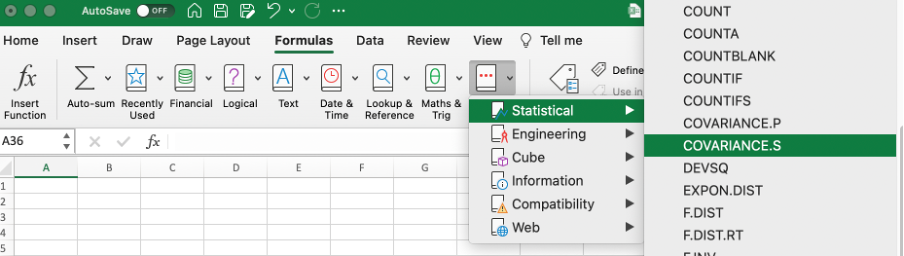
COVARIANCE.S function
It is a statistical function that returns covariance for the sample. It can be found in Excel under the Formulas tab:
The formula for the COVARIANCE.S function is:
=COVARIANCE.S(array1;array2)
The function uses the following arguments:
- Array 1: The first cell range of integers, and must be numbers, arrays, or references containing numbers.
- Array 2: The second cell range of integers, and must be numbers, arrays, or references containing numbers.
Things to consider when using the function:
- The formula considers only the arguments that are either numbers or names, arrays, or references that include numbers; all other values are ignored.
- The arguments must have the same number of data points; otherwise, the function returns the #N/A Error value.
- If either of the arguments is empty or contains only 1 data point each, the function returns the #DIV/0! Error value.
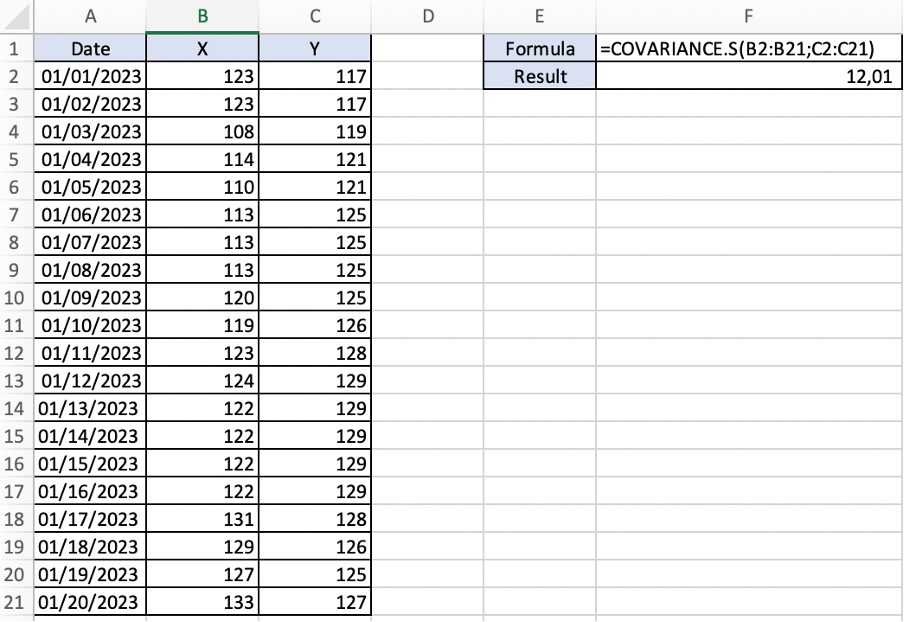
Example for the COVARIANCE.S function
Let's consider the share prices of two companies, X and Y, for 20 days.
- Array 1 (data in cells B2:B21) represents the share prices of company X.
- Array 2 (data in cells C2:C21) represents the share prices of company Y.
The goal is to understand the relationship between companies X and Y's share prices if any.
As we can see from the calculation below, the result returned by the formula is positive 12,01, indicating a positive covariance between the share prices of the two companies (when the share prices of company X go up, the share prices of company Y follow the same pattern).
However, a couple of instances when using the function may lead to inaccurate results:
- When the sample size is too small.
- When the data set contains many outliers.
Outlying returns can result in an inaccurate estimate of the measurement, which will have a direct impact on portfolio selection.
Applications of Covariance
Covariance has significant applications in the finance world.

1. Capital Asset Pricing Model (CAPM)
The covariance between security and the market is used in the formula for the capital asset pricing model (CAPM) key input, beta, which measures a security's volatility compared to the overall market.
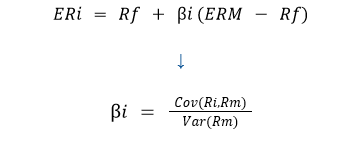
Where the parts of the equation are:
- Cov – Covariance
- Var – Variance
- Rm – Average expected rate of return on the market
- Ri – Expected return on an asset.
Capital Asset Pricing Model (CAPM) by WSO
2. Modern portfolio theory
The covariance reduces a portfolio's overall risk (a portfolio containing financial assets that combine varying covariances ensures more diversification).
At the same time, it is essential to remember that using covariances in portfolio management has drawbacks, as it cannot show the strength of the relationship between assets.
For example, suppose asset X and asset Y have a negative covariance. In that case, the covariance measure will not be able to tell what the percentage decrease in asset Y's return will be when asset X's return increases by 10%. The covariance measure will only show that asset Y's return will decrease.
Conclusion
The Excel functions COVARIANCE.P and COVARIANCE.S are useful resources for examining the combined variability of two data sets. They offer measures of covariance, which indicate whether there is a clear relationship between the data sets or whether they move in opposite directions or together.
These responsibilities are crucial in many domains, including finance, where they are integral to models such as current portfolio theory and the Capital Asset Pricing Model (CAPM). Through an understanding of asset covariance, investors are able to evaluate risk and make well-informed decisions regarding portfolio allocation.
However, it's important to keep in mind that covariance by itself does not adequately capture the nature of the relationship between the variables. Correlation coefficients are useful in determining the strength of a relationship because it lacks information about it.

Free Resources
To continue learning and advancing your career, check out these additional helpful WSO resources:


or Want to Sign up with your social account?