Days Sales in Inventory (DSI)
A financial ratio that measures the average amount of time it takes for a company to turn its inventory into sales


What Is Days Sales of Inventory (DSI)?
Days sales in inventory (DSI) is a financial ratio that measures the average amount of time, usually measured in days, it takes for a company to turn its inventory into sales. It considers the total inventory on hand plus any work-in-progress (WIP) or inventory currently in production.
DSI is also an essential component of the cash conversion cycle (CCC), which measures a company's time to turn its inventory into cash flows from sales. However, similar to other financial ratios, it provides little value on its own and hence must be compared across similar companies in similar industries.
- DSI is a financial ratio that measures the average time it takes for a company to turn its inventory into sales, usually measured in days.
- It considers total inventory on hand and work-in-progress (WIP) or inventory in production.
- DSI is an essential component of the cash conversion cycle (CCC) and should be compared across similar companies in the same industry for meaningful insights.
- Inventory turnover is related to DSI and measures how efficiently a company sells and replaces its inventory.
- A lower DSI is generally preferred, as it indicates efficient inventory turnover and strong sales, while a higher DSI may signify overstocked inventory or slow sales, but it may have other factors to consider, such as seasonal variations or preparation for future demand.
DSI And Inventory Turnover
Inventory turnover is an efficiency ratio that measures how many times a company sells and replaces its inventory, or goods in a given period. A higher inventory turnover ratio is preferred because it usually indicates strong sales.
Conversely, a lower inventory turnover could mean that there is an excess inventory on hand. This is different from DSI because a lower DSI is preferred to a higher DSI. Inventory turnover can be calculated by dividing a companies’ cost of goods sold by its average inventory. This formula is illustrated below.

Inventory turnover may be used as a variable in the DSI calculation by dividing the number of days over which the COGS was measured (for annual financial statements, this is usually 365 days) by a company’s inventory turnover.

Days Sales Inventory Formula
To calculate days sales in inventory, we need three inputs:
- Average inventory or ending inventory value, this will be the numerator in the quotient.
- Cost of goods sold (COGS) will be the quotient's denominator.
- Amount of time in the measurement period, which is usually 365 days for annual financial statements.
Please note that DSI can also be calculated by dividing the number of days (365) by the inventory turnover ratio (COGS divided by average inventory). Therefore, the final result should be the same in both methods.
We will go into more detail on where to locate each input and how to calculate DSI below.

Or

DSI Formula: Average Inventory
The first input will be average inventory; however, it is also common to only use the closing inventory at the end of the current measurement period. An important thing to note is that if the average inventory and ending inventory are significantly different, the DSI may be unreliable.
For this reason, average inventory is preferred over ending inventory because it accounts for seasonal sales during the measurement period. A company’s inventory can be found on the balance sheet.

The numerator in the quotient above is composed of beginning inventory, the amount of inventory as of the end of the last period, plus ending inventory, or the amount of inventory at the end of the current period.
The denominator of the quotient is the number of variables in the numerator. Since we are measuring the beginning and ending inventory values in one period, we will use a value of 2.
Let’s use a real-world example to calculate the average inventory for Procter & Gamble, a consumer packaged goods (CPG) company. We will use Procter & Gamble’s balance sheet to derive the average inventory for the fiscal year 2021.

Beginning Inventory (2020 Year End) = 5.5 Billion
Ending Inventory (2021 Year End) = 5.98 Billion

In the above example, the beginning inventory for 2021 was $5.5 billion, and the ending inventory was $5.98 billion. Therefore, we divide the numerator by 2 to get an average inventory of $5.74 billion for the year 2021.
DSI Calculation: Cost Of Goods Sold (COGS)
The second input is the cost of goods sold (COGS), which is the sum of the costs of each unit of goods sold. COGS only includes production costs, such as raw materials and labor, and excludes any costs after production, such as sales floor costs. COGS can be found on the income statement.
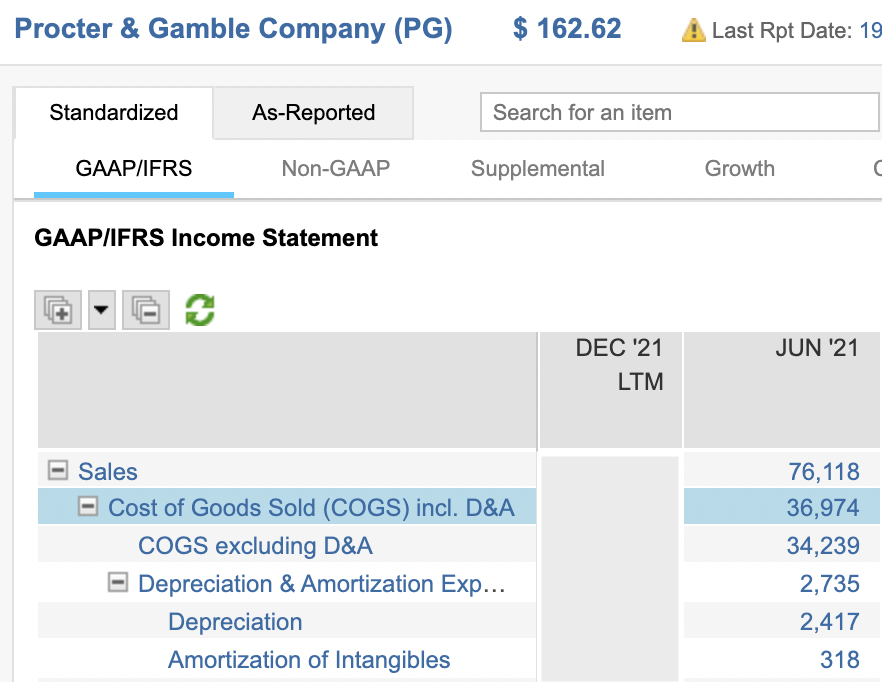
Continuing our example with Procter & Gamble, the cost of goods sold for 2021 was $36.97 billion.
DSI Calculation: Time
The final variable is time. It is dependent on the measurement period and when the financial statements were prepared. For example, if the other inputs were taken from an annual financial statement, this variable would equal 365 days (number of days in a year).
It is most common to use the number of days in the year (365); however, quarters, months, or weeks can also be used in the calculation. Since we are looking at annual figures in our example, we will use 365 days.
Days Sales In Inventory Calculation
Now we will use the average inventory, COGS, and time we derived from the balance sheet and income statement for Procter & Gamble to calculate the days sales in inventory for the fiscal year 2021.
Average Inventory = 5.74B
COGS = 36.97B
Time = 365 Days

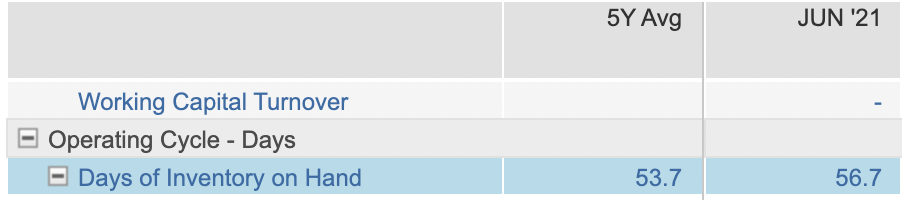
Using the formula for DSI, we see that it took Procter & Gamble an average of 56.67 days to convert its inventory into sales. On its own, this number provides little value because we would need to compare this to similar companies in the same sector.


Analyzing Days Sales In Inventory
DSI is considered an efficiency ratio because it measures how efficient a company is at converting its inventory into sales.
Below we will discuss what a high or low DSI output means and its shortcomings that must be taken into consideration.
When analyzing DSI, it is important to compare it to days sales in inventory of similar firms because on its own, it provides very little information.
In the Procter & Gamble example, a DSI of 56.67 days could seem like a long period of time, but when compared to other consumer packaged goods companies, Procter & Gamble may be more efficient at turning its inventory into sales.
It is also necessary to compare firms within the same sector because DSI can be significantly different from sector to sector.
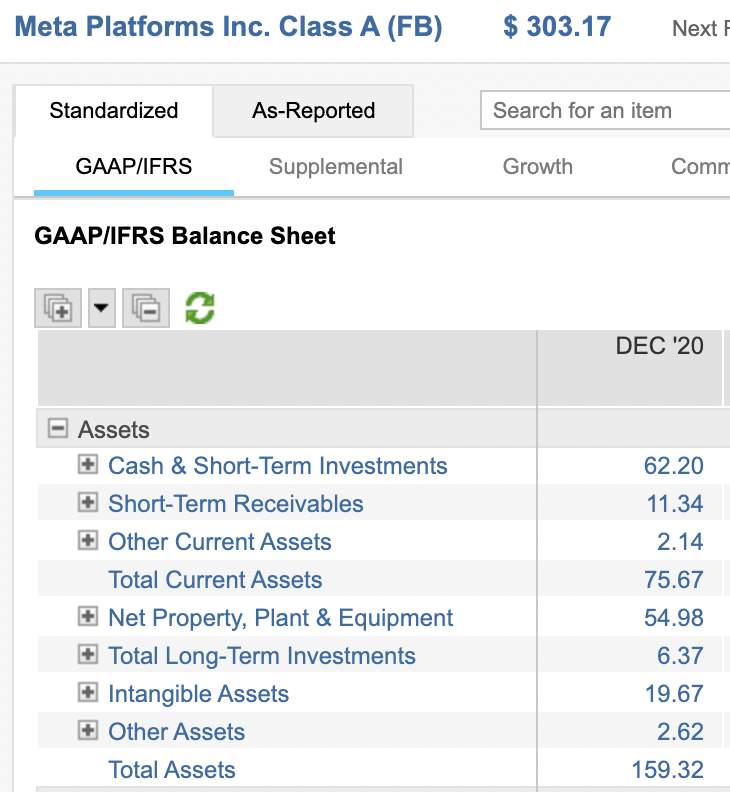
For instance, a consumer packaged goods company will likely have a higher DSI than a technology company. As of the fiscal year 2020, Meta Platforms (ticker: FB) doesn’t report any inventory on hand, essentially making DSI zero.
What Does A Low DSI Mean
A lower DSI is often desirable and is viewed positively by investors because it means a company can efficiently turn its inventory into sales. It may also be an indication that a company’s products are more desirable compared to its peers.
However, other factors must be taken into consideration. Below are some things to consider when DSI is low:
- Less profit: A company may have discounted its inventory price, leading to a lower DSI.
- Holistic view of inventory: DSI measures the total amount of inventory. Not all of the products may be fast movers. A low DSI could mask unpopular products.
- Inefficient inventory management: A low DSI could also indicate that a company isn’t keeping enough inventory on hand when sales are good.
Is High DSI Bad
A higher DSI is usually not desirable because it may mean that a company has overstocked inventory, which would lead to higher storage and carrying costs, or slow sales, which would hurt profitability.
A high DSI may also indicate that a company’s products are becoming obsolete. However, a high DSI may not always signify inventory or sales issues.
For example, a company may be stocking up on inventory to prepare for the holidays, or if it anticipates a shortage in the near future.
DSI Limitations
While days sales in inventory provides the average number of days it takes a company to turn its inventory into sales, it also has a few shortcomings (some were previously mentioned), which we will discuss below:
- Poor inventory management: Both a high or low DSI could indicate poor inventory management depending on the current market.
- Obsolete products: Management may decide to sell less popular inventory at a discount to increase sales, lowering DSI and giving the impression of having desirable products.
- Average vs. ending: If average inventory and the ending inventory balances are significantly different, using one over the other can give a low DSI while the other shows a higher DSI. This may cause DSI to be unreliable.
- Holistic view of inventory: DSI measures the total amount of inventory, and may mask obsolete product sales. Some products may be popular and sell quickly, while others may sit on the shelves for a prolonged period of time.
Due to these shortcomings, it is essential to view other financial ratios in tandem with DSI. It is also vital to compare DSI and other ratios to those of sector peers.
Examples Of Days Sales In Inventory
To better understand how days sales in inventory (DSI) are calculated, compared, and analyzed.
We will compare the DSI of two auto manufacturers, Tesla and Ford, and two semiconductor companies, Advanced Micro Devices, and Nvidia. Both of these comparisons are from the fiscal year 2020.
Tesla and Ford
In this example, we will compare the days sales in inventory of two auto manufacturers: Tesla, Inc. and Ford Motor Co., for the fiscal year ending in December 2020.
Tesla (ticker: TSLA) and Ford (ticker: F) are referenced as their tickers in the table below:
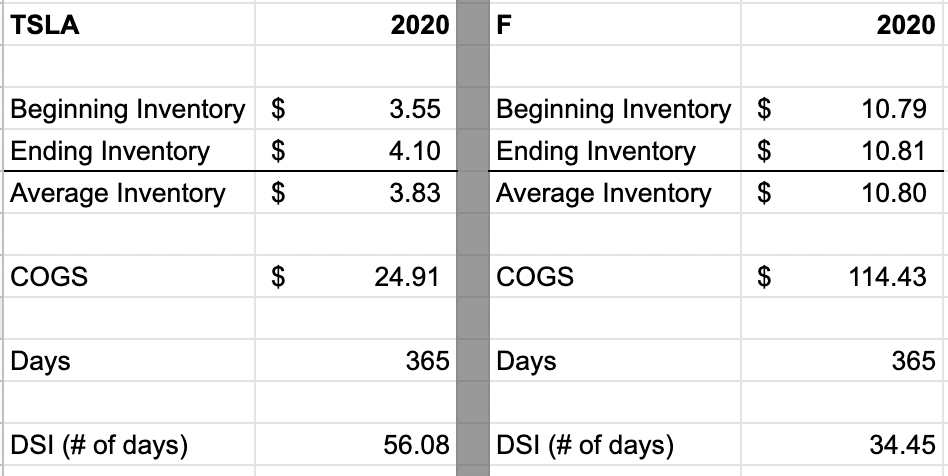
Tesla (TSLA), with a beginning inventory of $3.55 billion (B) and an ending inventory of $4.10 billion had an average inventory of $3.83 billion. Dividing the average inventory of $3.83B by total cost of goods sold (COGS) of $24.91B, and multiplying by 365, Tesla's DSI is equal to 56.08 days.
Ford (F), with a beginning inventory of $10.79B and an ending inventory of $10.81B, had an average inventory of $10.80B. Therefore, by dividing the average inventory of $10.80B by the total cost of goods sold (COGS) of $114.43B, and multiplying by 365, Ford's DSI equals 34.45 days.
Based on the DSI calculations for Tesla and Ford, Ford, in 2020, was more efficient at converting its inventory into sales; however, other things must be taken into consideration, such as product offerings and price point, to name a few.
- Product offering: as of 2020, Ford produces mainly cars that run on gasoline, while Tesla only produces electric vehicles.
- Price point: the average cost for a Tesla is higher than the average cost for a Ford, which would limit the number of customers, causing Teslas’ DSI to be higher.
It is also important to look at other metrics such as the cash conversion cycle, which measures the amount of time a company takes to turn it’s inventory into cash flows from sales.
Advanced Micro Devices and Nvidia
In this example, we will compare the days sales in inventory of two semiconductor manufacturers, Advanced Micro Devices and Nvidia.
Advanced Micro Devices (ticker: AMD) and Nvidia (ticker: NVDA) are referenced as their tickers in the table below:
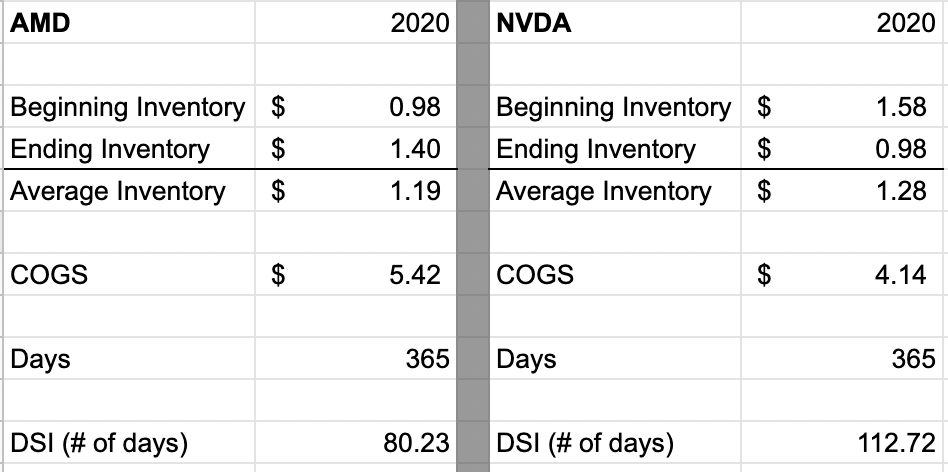
Advanced Micro Devices (AMD), with a beginning inventory of $980 million (M) and an ending inventory of $1.4 billion, had an average inventory of $1.19 billion. Dividing the average inventory of $1.19 billion by the total cost of goods sold (COGS) of $5.42 billion and multiplying by 365, AMDs’ DSI equals 80.23 days.
Nvidia (NVDA), with a beginning inventory of $1.58 billion (B) and an ending inventory of $980 million, had an average inventory of $1.28 billion. Dividing the average inventory of $1.28 billion by the total cost of goods sold (COGS) of $4.14 billion and multiplying by 365, Nvidias’ DSI equals 112.72 days.
Based on the DSI calculations for AMD and Nvidia, AMD, in 2020, was more efficient at converting its inventory into sales; however, other things must be considered, such as product offerings and supply chain, to name a few.
As of 2022, AMD relies on fewer suppliers (25) than Nvidia (54). This could add to longer production times for Nvidia.


More about financial modeling
To continue learning and advancing your career, check out these additional helpful WSO resources:


or Want to Sign up with your social account?