Linear Regression
A managed Machine Learning algorithm that forecasts a continual variable target dependent upon one or more independent variables.


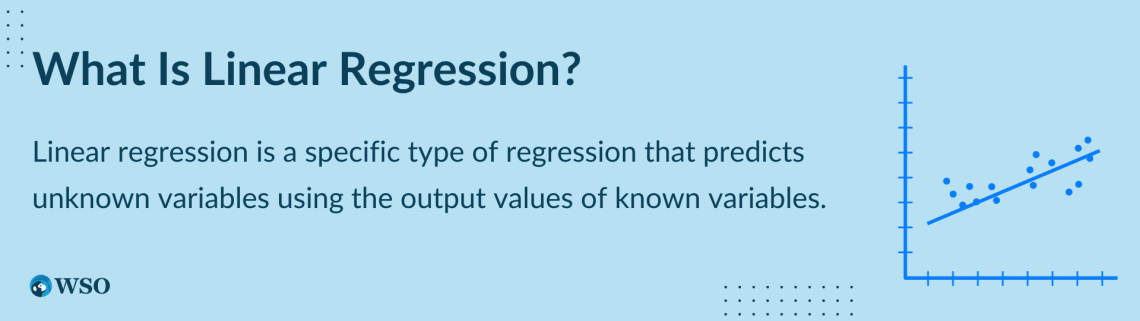
What Is Linear Regression?
The Linear Regression is a managed Machine Learning algorithm that forecasts a continual variable target dependent upon one or more independent variables.
To understand it or any type of regression, let us first explain the concept and definition of regression.
Regression analysis is supervised machine learning that predicts a number from infinitely many possible outputs. For example, predicting the price of a house of a given size based on previous data on cost and size is regression modeling because the output(price) can have infinitely many values.
On the other hand, checking if an email is spam is not a regression as the output has only two values, either the email is spam or not. Such a type of supervised machine learning is called classification.
Regression is of two types:
- Linear Regression
- Logistic Regression
Linear Regression is a type of supervised machine learning that predicts values of unknown variables based on the output value of other known variables.
The variables whose output we want to predict are called the dependent variables. The variables whose output value we use to train our machine are called the independent variable or the training set.
NOTE
This regression is one of the simplest and most basic predictive analysis techniques. It is also the most commonly used technique for data and statistical analysis.
- Linear regression is a statistical method for modeling the relationship between a dependent variable and one or more independent variables. It aims to find the linear equation that best predicts the dependent variable based on the independent variables.
- The Purpose of linear regression is to predict and estimate future values, understand relationships between variables, and consider data insights that provide insights into the data structure and the impact of different variables.
- There are two types of linear regression: simple linear regression, which involves one dependent variable and one independent variable, and multiple linear regression, which involves one dependent variable and multiple independent variables.
- The key assumptions of linear regression include linearity, independence, homoscedasticity, and normality.
How To Calculate Linear Regression?
Linear regression analysis fits the input-output data as a straight line on the graph, with the output data on the y-axis and the input data on the x-axis. This technique then predicts output values for new input values by extrapolating the straight-line graph.
A linear regression curve as a mathematical equation is of the form:
f(x) = wx + b
Here:
- x - The independent variable or the training set
- f(x) - The predicted value or the dependent variable for any input x
- w and b - the parameters/coefficients/weights
The values of the parameters w and b, along with the input variable x, also affect the predicted value. Here, w is the slope of the linear regression line, and b is the y-intercept(the value of y when x is 0).
The least-squares method helps to fit a regression line. The line that predicts the most accurate value closest to the actual output for any input label is called the best-fitting line.
NOTE
This method helps to find the best-fitting line for the observed data by minimizing the squared sum of the vertical deviations from each data point to the line.
Once we have identified the best-fitting line, we may encounter some points lying far from it. These are called outliers. They represent erroneous data. If there are a large number of outliers, it indicates a poorly fitted regression line.
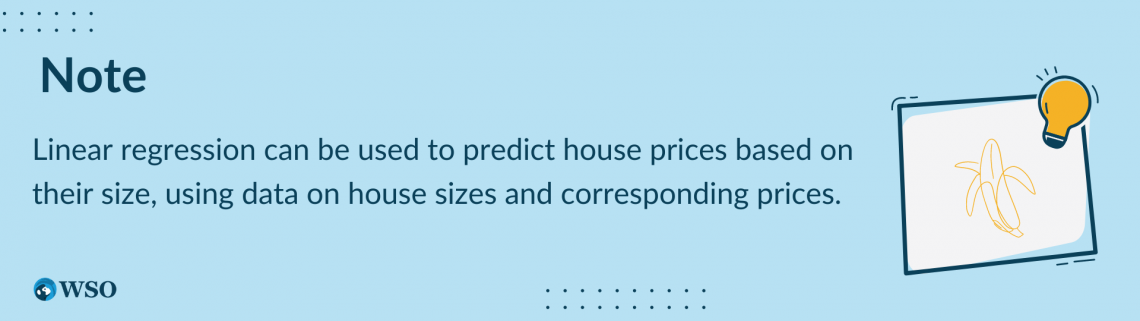
As discussed above, predicting the price of houses based on their size, given the data about the size and corresponding prices for many houses, is an example of linear regression analysis. We can model this data and use it to predict the price of a house of any given size.
This kind of analysis is called linear regression in a single variable as it has only one input label or the independent variable, the size of the houses, represented mathematically by the variable x.
We can also have complex regression models with more than one independent variable like the size of the house, number of bedrooms, number of bathrooms, and many more.
Such models are called multiple linear regression. Their straight-line dependence on the independent variables can be shown mathematically:
f(x) = w1x1 + w2x2 + w3x3 + w4x4+ ….. + wnxn + b
Here w1, w2, w3…..wn, and b are the coefficients or parameters, while x1, x2, x3…...xn are the independent variables.
NOTE
In a linear regression, we can estimate the coefficients/parameters of the linear equation that predict the dependent variable's most accurate and closest value using the least-squares method discussed above.
We try to choose parameter values that minimize the discrepancies and variation between the predicted and actual output values. Our target is to train the machine to predict the output values as closely as possible to the actual value.
Once we get the values of the parameters/coefficients, we can get the predicted values for any input value x.
We can perform the linear regression analysis on many programs and environments:
Importance of Linear Regression
It is a relatively simple method to perform data analysis. It is less complicated and easy to learn and understand. This technique provides a mathematical formula that is easy to interpret, making it easy to generate predictions.
The advantage of using this analysis technique is that we deal with a straight-line equation, which is probably the simplest case in mathematics compared to the equation of other complex curves like hyperbola and ellipse. Hence it makes our job easier.
Today, it is the most commonly used technique for data analysis by businesses, working professionals, and academics. These models help in almost every industry: biological, environmental, education, and businesses.
Linear regression analysis has proven to be a highly reliable, accurate, and scientific method for predicting future values.
Data analysts are familiar with its concepts because these models have been employed in statistical analysis for a long time. Therefore, they soon become machine-trained.
Such models and analyses help businesses, entrepreneurs, and working professionals make better and more informed decisions.

Companies collect huge amounts of data regarding the sales and demand of their products, and it helps them get a better idea of their reality and provides future predictions.
Companies can use these future predictions to take corrective actions and improve their sales instead of relying on raw data and intuition. We can transform large amounts of raw data into insightful information using this predictive technique.
It can also help businesses analyze their sales and purchase data to realize their specific purchasing patterns on particular days. These insights can help them anticipate when there will be high demand for their products.
Common Assumptions Of Linear Regressions
We need to make some assumptions to simplify things and develop a successful model efficiently without wasting much time. Here they are:
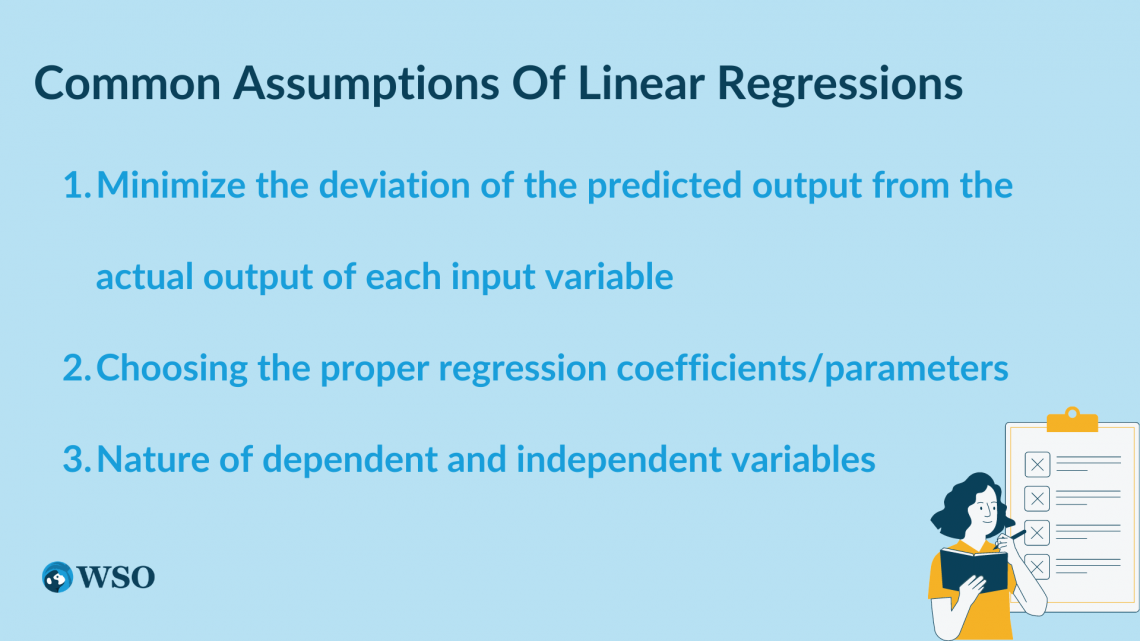
1. Minimize the deviation of the predicted output from the actual output of each input variable
Simply put, we need to consider the number of valid cases(inputs), mean, and standard deviation of the predicted output of each input variable concerning the actual output. We need to minimize this deviation to develop a successful and accurate model.
2. Choosing the proper regression coefficients/parameters
We need to consider the regression coefficients or parameters for our model.
To develop a successful regression model, we need to choose these regression parameters such that the predicted output and the actual output do not differ much. We also need to consider the correlation matrix and the standard error of the estimate.
We also need to consider the confidence interval while creating our regressive model. We generally consider a confidence level of 95% for our modeling.
NOTE
The confidence level helps to determine the accuracy of our model.
3. Nature of dependent and independent variables
All dependent and independent variables must be quantitative, as linear regression models can only predict numbers. We cannot provide non-numeric entities as the training set.
The dependent variable should have a normal distribution for each independent variable value. This normal distribution should have a constant variance for all independent variable values.
NOTE
The dependent variable and each independent variable should have a linear relationship with each other.
Before performing linear regression analysis, you must ensure that the data fulfills these assumptions. We can use a scatter plot to verify the linear relationship between the two variables quickly.
The predicted values for different input labels should be independent of each other.
The data should not have significant outliers. Along the best-fit line for the model, the variance between the predicted and actual output must remain the same. The estimation errors along the best-fit line should always follow a normal distribution.
Practical Applications of Linear Regression Analysis
Let us see some practical applications of linear regression analysis:
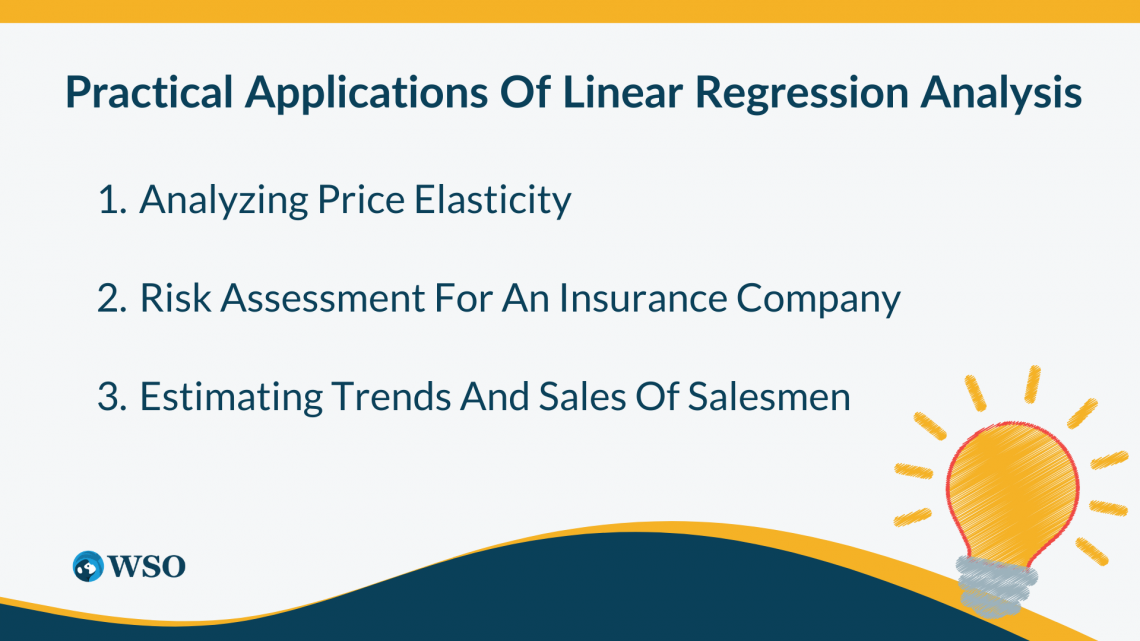
1. Analyzing Price Elasticity
Changes in the price of goods impact consumer demand, which is bound to affect a company's sales. Companies use it to analyze the effect of pricing on consumer behavior, hence determining the price elasticity to calculate the optimum price of the produced goods.
This helps businesses maintain an equilibrium between consumer demand and their profit margin. For example, using linear regression, you can estimate whether the consumption drops as the prices of a commodity increase.
For example, suppose the sales and revenue of a company increase continuously each month for two to three years.
The company can conduct a linear analysis of the sales and revenue data to predict the number of sales in the coming months. This helps them analyze the demand for their product in the market and their market demography.
Whether the consumption drops significantly upon increasing the prices and maximum price, after which consumption begins to decrease significantly and eventually stops, can be evaluated using such analytical models.
NOTE
Analyzing Price Elasticity is very important for retail businesses.
2. Risk Assessment For An Insurance Company
It is commonly used in risk assessment. For example, if an insurance company has limited resources to assess their client’s insurance claims, they can estimate the claims costs by building a regressive model.
NOTE
Risk Assessment helps the company in making informed decisions and prevent financial losses.
3. Estimating Trends And Sales Of Salesmen
It can also help predict a salesman's total yearly sales (output or dependent variable) concerning age, educational qualification, and work experience(input or independent variable).


Free Resources
To continue learning and advancing your career, check out these additional helpful WSO resources:


or Want to Sign up with your social account?