Cash Ratio
A measure of the company's ability to pay off its short-term debt obligations.


What Is The Cash Ratio Formula?
The cash ratio formula measures the company's ability to pay off its short-term debt obligations by using only cash or near-cash assets like Cash & Bank and marketable securities.
It essentially checks how a company can manage its assets during the worst-case default scenario.
It is a type of liquidity ratio. Liquidity ratios are specifically designed to calculate how liquid a company's balance sheet is. A company with good liquidity ratios has a strong balance sheet because it can pay off its immediate debt obligations without tapping into its longer-term assets.
Creditors use the cash ratio to assess how many loans they can give to the business.
Formula

The formula includes those components as the formula checks how a company can pay off its short-term obligations only through its liquid assets.
- Cash & Cash Equivalents (CCE): CCE includes cash on the books and highly liquid short-term investments like T-Bills, Commercial Papers, Marketable securities, etc. All these securities are to be taken at their book values. Assets with lower liquidity, like receivables and inventory, are excluded from the calculation.
- Current Liabilities: Current Liabilities are to be taken at their book value.
- The cash ratio measures a firm's liquidity is analyzed by comparing cash and cash equivalents to its current liabilities. It indicates the firm's capacity to pay off short-term debts using its most liquid assets.
- A cash ratio of 1 or more suggests that the company can cover all its short-term obligations with its cash reserves. Ratios below 1 indicate potential liquidity issues.
- Unlike the current and quick ratios, which include receivables and inventory, the cash ratio provides a more stringent assessment of a company's liquidity by focusing solely on cash and cash equivalents.
- The cash ratio is particularly valuable for investors and analysts assessing companies in industries where maintaining high liquidity is critical.
Understanding & Interpreting the Cash Ratio
The ratio is a liquidity ratio used to measure how the business can utilize its highly liquid assets to pay back short-term obligations without liquidating its inventories, long-term assets, or any investments.
Several other liquidity ratios, like Acid tests, Current Ratios, etc., are used to test the balance sheet under different conditions.
Lenders primarily use it to assess how a company is positioned and whether it can bear sudden default events. If the ratio favors the creditors, they can only provide a loan to the business.
It can also be used for risk assessments; if a firm has an inadequate ratio, it can affect the credit rating, making it riskier and increasing its current borrowing rates.
Current liabilities are obligations that are due within one year.
The ratio calculation results in a number that can be used as a multiple. For, if the ratio comes out as 1, the firm has the same amount of CCE and current liabilities. Or CCE is 1x (1 time) the current liabilities.
The ratio is preferred to be at least 1 for a company to be considered in a good position, but there are a few exceptions to interpreting the ratio.
The Ratio is Equal to 1
If the ratio is equal to or closer to 1, the firm is said to have adequate cash assets to repay all its near-term obligations.
The CCE & CL are Equal
Usually, if firms have enough cash, they prefer keeping the ratio above one to be safe. However, a ratio of 1 is usually interpreted by lenders as favorable, and the company can add more debt.
The Ratio is Greater than 1
This is the most favorable scenario for any firm. A CR greater than one can also give a rough picture of the company's overall health.
It means that the company is generating enough cash through its operations that it can maintain a very strong liquid position.
However, a very high ratio suggests that the company does not have enough avenues to reinvest. Thus the excess cash is sitting on the books, which can be paid as dividends or buybacks to enhance shareholder value.
A high ratio can also be a result of lower current liability requirements. For example, tech companies that have very low to no working capital requirements usually have very low levels of current liabilities.
The interpretation of a high ratio can entirely depend on the type of business and management decisions.
The Ratio is Less than 1
A less than one CR tells that the company will need to tap into other liquidity sources like inventories, investments, and non-current assets to fulfill the immediate liquidity requirements.
Businesses that are in their nascent stages and cannot generate enough cash or businesses with extremely high working capital requirements usually have lower cash ratios.
There are some exceptions to this as well.
If a business is generating heavy free cash flows, they don't need to have a lot of CCE on its books, as the generated free cash flows can pay any sudden short-term obligations.
Calculating the Cash ratio
To clearly understand the ratio, it is better to work with a working example from a 10-K.
Example 1: Pfizer Inc. (PFE)
The following data is taken from the 10-K of Pfizer.
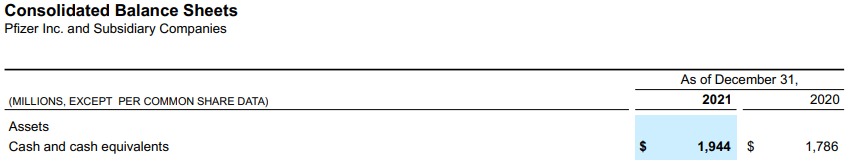

The Cash Ratio of Pfizer Inc for the year 2021 will be
CR = $1944 / $42671
CR = 0.045
Pfizer has a ratio of 0.045 for 2021, which has declined from 0.06 in 2020.
This tells that Pfizer does not have enough cash& cash equivalents on its books to repay its current liabilities. This could suggest it has a weaker balance sheet.
However as Pfizer generates a mature business that generates very heavy free cash flows, it does not keep a lot of cash on the balance sheet.
Example 2: Alphabet Inc. (GOOGL)
The following data is taken from the 10-K of Alphabet Inc.
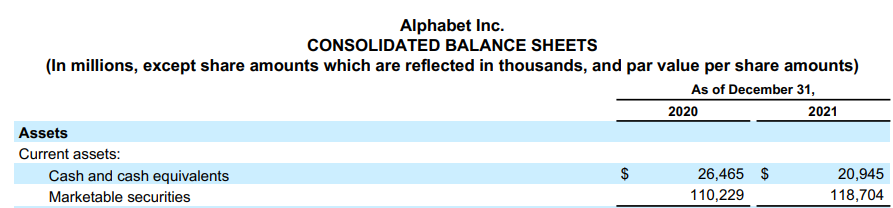

Alphabet has total cash & cash equivalents + marketable securities of $136,694
The Cash Ratio for Alphabet is
CR = $136,669 / $58,834
CR = 2.32
This tells that Alphabet has 2.32x cash compared to its current liabilities in 2021, which has gone up from 2.17x in 2020.
This tells that Alphabet has a very strong liquidity position and can pay off all its current liabilities with cash & cash equivalents and marketable securities.
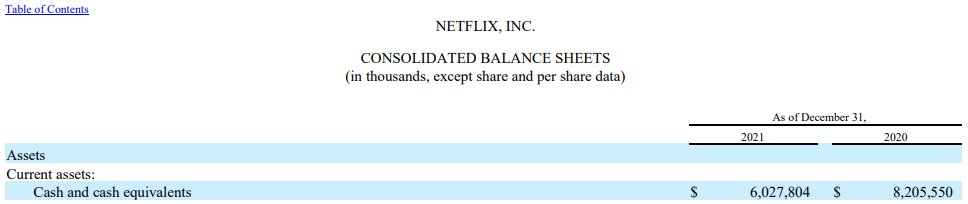
Example 3: Netflix (NFLX)
Data is from the annual 10-K filings of the company
![]()
CR = $6207804 / $8488966
The cash ratio for Netflix stands at 0.73; the ratio is lower because Netflix still has considerable reinvestment needs; for a growing company, the ratio is usually below one as its major concern is growing its top line and not strengthening its balance sheet.
The above three examples show how the ratios could differ for different businesses.
Pfizer, a mature firm with heavy free cash flows, does not need a lot of cash as they have sufficient free cash flows. Similarly, Netflix also has low cash, but that is the product of its high reinvestment needs.
While Alphabet is also generating heavy free cash flows chooses to keep cash on its books.
Advantages and Limitations Of Cash Ratio Formula
It is essentially a liquidity measure for a company. Liquidity ratios are targeted explicitly towards balance sheets, so a few advantages and limitations come.
Advantages
The ratio looks at how much cash balance a company is maintaining compared with its current liabilities. This allows creditors to judge how the company is using its cash.
Compared to liquidity measures which take other items on the current assets like inventory, the ratio is more reliable as the market value and liquidation value of the inventories can differ wildly, which can give a misrepresented figure, unlike cash & cash equivalents.
A company's cash on its books can tell a lot about the company and its management style if looked at with other metrics on the financial statements.
For example, if a company has low cash, it can mean that it either is not performing on the bottom line or has a high reinvestment need, or it can suggest that the company has high free cash flows, so a high level of cash need not be maintained.
An increase in the ratio can suggest that the firm is increasing its cash balances, maybe for some big investments or M&A.
Being more conservation than other liquidity measures, only showing the most liquid assets shows the true strength of the company's balance sheet and efficiencies.
Limitations
The ratio is unrealistic in terms of a true liquidation event. Even though CCE is the most liquid asset on the balance sheet, it does not mean that other current assets can't be used to pay back short-term obligations in the event of a default.
Ignoring items like current investments, which are just as liquid, can also limit the ratio.
Realistically it is rare for companies to keep this much cash on the balance sheet as it can be deployed in much more productive like reinvestments and dividends.
Cash ratio as a stand-alone ratio tells us very little about the business; it has to be looked at with several other factors like the type of company, in which stage of the corporate lifecycle the company is, management decisions, etc.
There is a certain ambiguity to what can be considered cash equivalents; it can differ from industry to industry and can also be affected by accounting standards.
A company's cash balances can vary a lot; line items like sales, costs, inventory levels, receivables, and payables can influence the cash balances of a firm.
Cash Ratio vs. Quick Ratio/Acid Test
Like the cash ratio, the quick ratio indicates a company's short-term liquidity position. Still, unlike the cash ratio, which only includes cash & cash equivalents, the acid test uses all current assets except the inventory to calculate the company's liquidity position.
A quick ratio of 1 or above is deemed favorable for a firm.
A quick ratio is usually preferred over the cash ratio because it includes other line items in the current assets giving a more accurate representation of the liquidity.

The quick ratio ignores inventory because it can be difficult to liquidate it, and the actual difference between the market value and liquidation value for the inventory can differ by a lot.
The liquid assets included in the acid tests should be convertible to cash within 90 days, so some line items like receivables taking over 90 days will be excluded from the calculation.
The significant difference between the two tests is the assets included in the calculation; the CR uses assets with the highest liquidity, while the quick ratio uses assets that can be converted into cash within 90 days.
Cash Ratio vs. Current Ratio
The current or working capital ratio is a liquidity measure that measures a firm's ability to pay its short-term obligations.
Unlike quick & cash ratios, which altered the line items of the current assets, the current ratio considered the firm's entire current assets for estimating liquidity.

Like the liquidity mentioned above measures, a ratio of 1 is looked upon favorably.
If the ratio is below one of the industry averages, it means that in a distressing event, the company will have a higher risk of default. On the other hand, if the ratio is much above the industry average, the assets are not being used efficiently, or the management is very conservative.
It is called the working capital ratio because it uses the company's working capital CA & CL to estimate liquidity.
The drawback of the current ratio, when compared with the acid test or cash ratio, is that it does not eliminate any line items, which will result in misrepresentation as all the line items have different liquidity and market values compared to their book values.


Free Resources
To continue learning and advancing your career, check out these additional helpful WSO resources:


or Want to Sign up with your social account?