Return on Common Equity
A metric that measures profitability, indicating the percentage of profit generated relative to shareholders' equity investment.


What Is Return On Common Equity (ROCE)?
Return on common equity is a financial ratio used to evaluate a company's profitability from the perspective of its common shareholders. This ratio measures the rate of return generated by a company on the capital invested by its common shareholders.
Individuals, organizations, and other investors who own common shares in the corporation are considered common shareholders.
For investors, analysts, and management, the ratio is a critical performance measure since it sheds light on how well a business uses its equity to produce profits.
It is determined by dividing the net revenue of an organization by the average common equity for the time period. The part of a company's assets owned by its common shareholders is known as common equity.
It includes the value of the company's common stock, retained earnings, and other equity accounts. The formula for calculating this ratio is as follows:
Return on common equity = (Net Income / Average Common Equity) x 100
Where:
Net Income = Total Revenue – Total Expenses
Average Common Equity = (Beginning Common Equity + Ending Common Equity) / 2
It is expressed as a percentage, and a higher ratio indicates a more efficient use of equity.
For instance, a return on common equity of 15% implies that the company generated 15 cents in net income for every dollar invested in common equity.
A greater ratio is generally desirable since it shows that the business is making more money in relation to the amount of equity invested.
This metric provides valuable insights into a company's operational effectiveness and is a helpful tool for analysts and investors. A high ratio indicates that the company is generating healthy profits and is using its equity efficiently.
Companies with consistently low metrics may face pressure from investors to improve their profitability or make changes to their business operations. Conversely, businesses with higher ratios than their competitors may be more attractive to investors since they generate more profit relative to the equity invested.
NOTE
Return on common equity is also an important metric for management, as it can provide insight into areas where the company can improve its profitability.
By analyzing the components of this ratio (i.e., net income and average common equity), management can identify areas where the company can reduce expenses or increase revenue.
For instance, if a company's low return on common equity results from excessive spending, management can focus on cost-cutting measures or simplifying operations to improve profitability.
It is a key performance indicator measuring the efficiency with which a company utilizes its common equity to generate profits.
- Return on Common Equity (ROCE) measures a company's profitability by evaluating how effectively it generates income from the common equity invested by shareholders.
- ROCE is calculated by dividing net income (minus preferred dividends) by the average common equity, expressed as a percentage: ROCE = (Net Income - Preferred Dividends) / Average Common Equity.
- A higher ROCE indicates that a company is effectively utilizing its common equity to generate profits, making it an important metric for investors assessing management efficiency and company performance.
- ROCE focuses specifically on the returns generated for common shareholders, excluding the effects of preferred dividends, providing a clear picture of equity efficiency.
Other Financial Ratios Compared to Return on Common Equity
To have a complete picture of a company's financial status, it is crucial to consider how return on common equity connects to other financial statistics.

It is a helpful indicator of the company's profitability from the perspective of the common shareholders. Financial ratios frequently compared to this metric include the following:
- Return on Assets: It provides insight into how efficiently a company uses its assets to generate profits.
- Return on Investment (ROI): It incorporates the initial investment and any prospective future returns and is computed as a percentage of the initial investment. ROI may be used to compare the returns on various kinds of investment and can give information on the likelihood of a profitable investment in a certain firm.
- Gross Margin: Gross margin may be used to assess the profitability of various goods or services a company offers while also giving insight into the profitability of its core business activities.
NOTE
Financial ratios should not be employed in isolation; rather, they should be considered along with other elements, including market circumstances, industry trends, and management initiatives.
Comparing this metric to these other financial ratios can provide a more comprehensive understanding of a company's financial health.
For instance, even though a firm may make good profits, it may have a high return on common equity but a low ROI, suggesting that the prospective return on investment is only moderately high.
Conversely, a company may have a low return on common equity but a high gross margin, indicating that the company's core business operations are profitable. Still, the company may be experiencing challenges in generating profits from its equity.
Limitations And Merits of Return On Common Equity
Return on common equity is a commonly used financial metric for measuring a company's profitability and efficiency from the perspective of its common shareholders.
To fully comprehend a company's performance, it is crucial to remember that this metric has limits as a solo performance indicator and should be considered with other financial and non-financial measures.
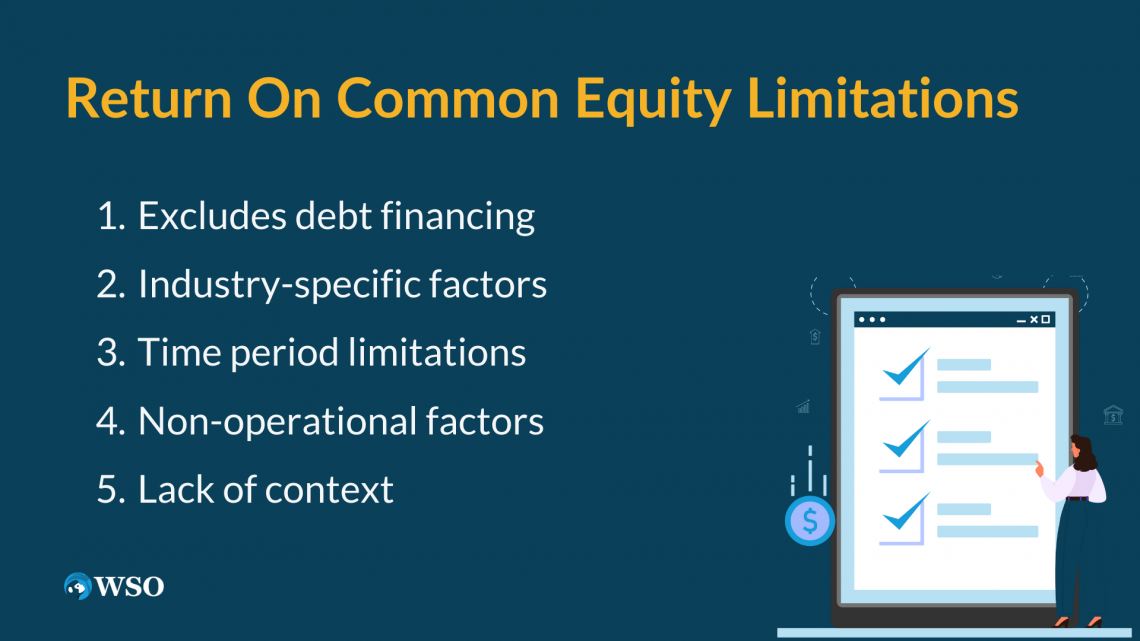
The following are some drawbacks of utilizing this metric as the only performance indicator:
- Excludes debt financing: It measures the profitability of a company's equity but does not consider the impact of debt financing on its financial health. A high ratio alone may not indicate long-term financial stability if the company heavily relies on debt funding.
- Industry-specific factors: It may not be a helpful indicator for comparing firms across sectors since industry-specific factors can substantially influence a company's profitability and efficiency.
- Capital-intensive business manufacturing, for instance, can have a lower ratio than a service-based economy because of the greater expenditures for premises and equipment.
- Time period limitations: It is typically calculated for a single fiscal year, which may not provide a comprehensive view of a company's long-term performance.
- Even if a firm has a high ratio in one year, its total financial health may not be reflected by that high ratio if profitability and efficiency fall off in the following years.
- Non-operational factors: This statistic is affected by non-operational factors, including taxes and currency rates. As a result, even if a company's main business operations are going well, it might reduce its profitability and efficiency.
- Lack of context: It does not include information on a company's market share, customer happiness, or management tactics in relation to its financial success. It might not offer a thorough view of a company's total success without considering these elements.
Investors and analysts should consider this metric alongside other financial and non-financial metrics to overcome these limitations. These metrics are listed below:
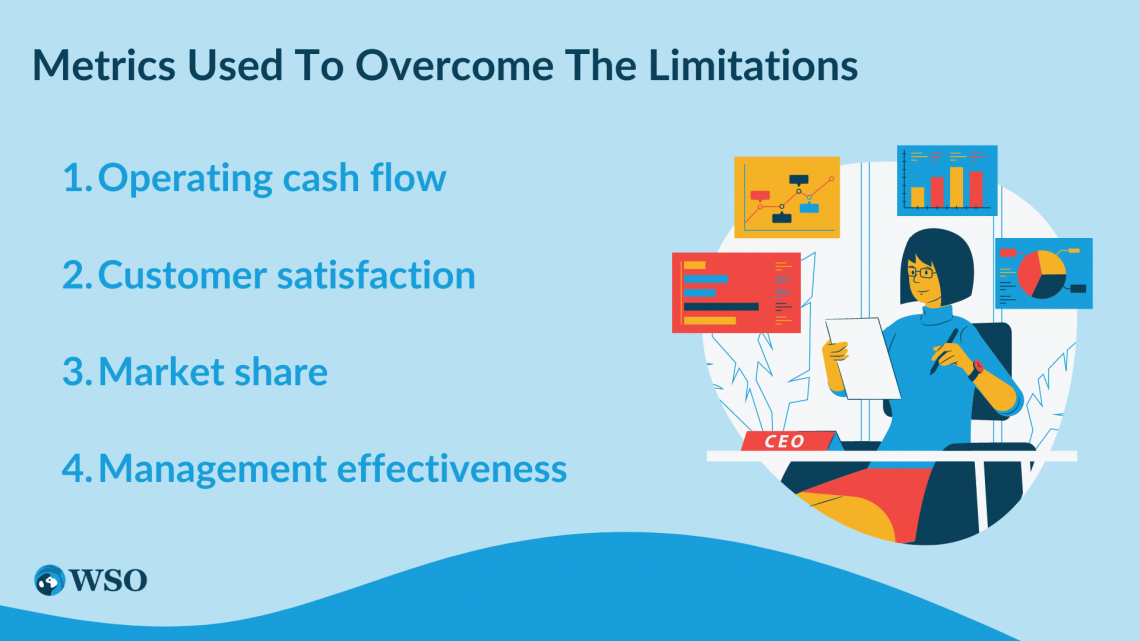
- Operating cash flow: Measuring the cash flow generated by a company's core business operations provides insights into its ability to support operations and investments.
- Customer satisfaction: Customer satisfaction gauges how happy consumers are with a firm, and it can give information about that organization's capacity to keep customers and make money.
- Market share: Assessing a company's market share indicates its competitiveness and market position within its industry.
- Management effectiveness: The capacity of a management team to make strategic decisions and increase profitability for the firm is measured by management effectiveness.
Case Studies Of Companies with High and Low Return On Common Equity
Return on common equity is a critical financial metric that measures a company's profitability and efficiency from the perspective of its common shareholders.
We will go through two case studies of businesses, one with a high and one with a low metric, to show how this measure may provide us with information about how financially sound a firm is.
High Ratio: Microsoft Corporation
A technological corporation called Microsoft Corporation creates and licenses software in addition to selling computer hardware and other associated services.
In the fiscal year 2021, Microsoft had a ratio of 27.06%, which is significantly higher than the average of the software and technology industry.
One factor contributing to Microsoft's high ratio is its strong market position. Many personal computers run the Windows operating system from Microsoft, and its Office software suite is a popular productivity tool.
In addition, Microsoft has expanded its offering by including cloud computing services, which have grown significantly in recent years.
Another factor that has contributed to this is its strong fiscal management.
The business has regularly produced above-average cash flow levels from its core activities, allowing it to finance R&D and undertake tactical acquisitions that have improved its market position.
Microsoft's high return on common stock reflects the company's strong market position and sound financial management, allowing it to produce sizable profits for its shareholders.
Low Ratio: General Electric Company
General Electric Company is a global conglomerate that manufactures a variety of goods and services, such as aviation engines, power plants, and medical equipment.
In the fiscal year 2020, GE had a ratio of -4.04%, significantly lower than its industry average.
One significant factor is the company's high debt burden. GE has faced challenges with rising debt in recent years and has been compelled to sell off assets to generate cash and reduce its debt load.
The high debt level negatively impacts the company's profitability and long-term financial stability, resulting in a low return on common equity ratio.
Additionally, GE's power division has experienced significant financial losses, further impacting the company's overall profitability. Inefficient management of its business portfolio has also contributed to GE's low ratio.
NOTE
Recently, the organization sold off a number of underperforming companies, but it also made several purchases that didn't result in significant gains for shareholders.
The company's high debt level and poor management decisions, which have harmed its profitability and long-term financial stability, are reflected in GE's low ratio overall.
The case studies of Microsoft and GE illustrate how this metric can provide insight into a company's financial health. Companies like Microsoft can provide big returns for their shareholders because of their strong market position and efficient financial management.
Investors and analysts may acquire a thorough knowledge of a company's overall financial health and long-term prospects by considering this, along with other financial indicators and non-financial elements.
Return On Common Equity FAQs

It is computed by dividing a company's profits before interest and amortization by its average common equity over some time. The result is expressed as a percentage.
A high ratio varies by industry, but a metric above 15-20% is considered high. Companies with a high ratio are typically considered efficient and profitable.
A low ratio varies by industry, but a ratio below 10% is considered low. Companies with a low ratio are typically considered inefficient and may not be generating sufficient returns for their shareholders.
Yes, it can be negative if a company's EBIT is negative or its common equity is negative or zero. A negative ratio may indicate that a company is experiencing financial difficulties and is not generating sufficient returns for its investors.

Free Resources
To continue learning and advancing your career, check out these additional helpful WSO resources:


or Want to Sign up with your social account?