Double Exponential Moving Average (DEMA)
An indicator devised to reduce the lag in the results produced by a traditional moving average


What Is a Double Exponential Moving Average (DEMA)?
The Double Exponential Moving Average (DEMA) is an indicator devised to reduce the lag in the results produced by a traditional moving average.
Traders use DEMA to lessen "noise" that can distort the price movements on a chart. Like any other moving average, the DEMA indicates the trend in the price of a stock or any other asset.
By tracking its price over time, a trader can spot an uptrend or a downtrend when the price moves above or below its average. When the price crosses the average, it signals a sustained change in the trend.
As the name implies, the DEMA uses two exponential moving averages (EMAs) to eliminate lag in the charts. The double name comes from the fact that the value of an EMA (Exponential Moving Average) is doubled.
Double exponential moving averages are an improvement over exponential moving averages (EMAs), as they allocate more weight to recent data points.
The reduced lag results in a moving average, which is more responsive and helps short-term traders spot trend reversals quickly.
In 1994, Patrick Mulloy introduced this variation on the moving average in an article, "Smoothing Data With Faster Moving Averages," in the Technical Analysis of Stocks & Commodities magazine.
- DEMA minimizes lag in moving averages, offering a more responsive indicator for traders to identify trends and reversals in asset prices.
- DEMA combines smoothed Exponential Moving Averages (EMA) and a basic EMA, using a formula with a chosen lookback period to enhance sensitivity to stock volatility.
- While DEMA reduces lag, it may result in overtrading and missed opportunities due to its sensitivity. It is recommended to use DEMA in conjunction with other analyses, such as fundamental and price action analysis.
Calculating the Double Exponential Moving Average (DEMA)
DEMA combines smoothed Exponential Moving Averages (EMA) and a basic EMA. This combination reduces the lag in the combined DEMA.
There are four steps in the calculation:
- Choose any lookback period, such as 10 periods, 50 periods, or 100 periods.
- Calculate the EMA for that period, i.e., EMA(n).
- Apply an EMA with the same lookback period as EMA(n). This will produce a smoothed EMA.
- Multiply two by EMA(n) and subtract the smoothed EMA.
The formula to calculate is:
DEMA = [2 x EMA(n)] - [EMA(n) (EMA(n0)]
Where,
- N = Look-back period
For example, let us look at Apple Inc.'s price over nine months, from April 2020 to November 2020. The chart uses candlesticks, which reflect Apple Inc.'s stock price change for each period.
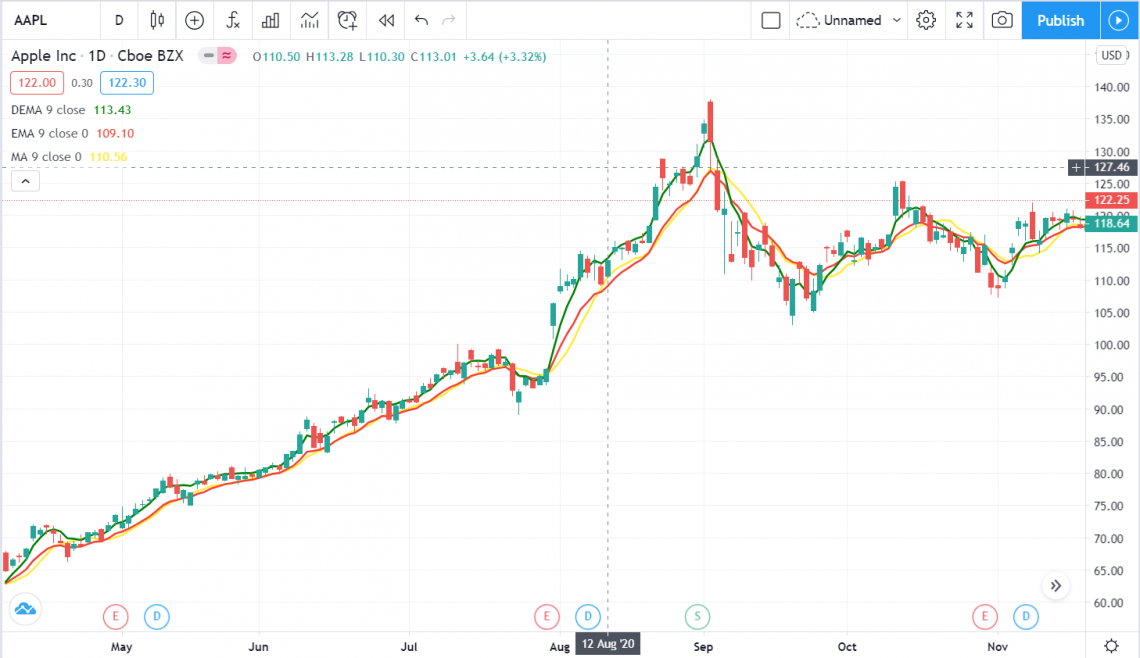
Source: Trading View
The red line indicates the Exponential Moving Average (EMA), the yellow line is the Simple Moving Average (SMA) line, and the green line is the DEMA. We can observe that DEMA is closest to the price points, with the slightest deviations.
Since the DEMA line mimics stock prices closely, it is most sensitive to stock volatility. A change in volatility is a good indicator of a trend reversal and stock trades. Let us look at the differences when the number of days for the DEMA is changed:
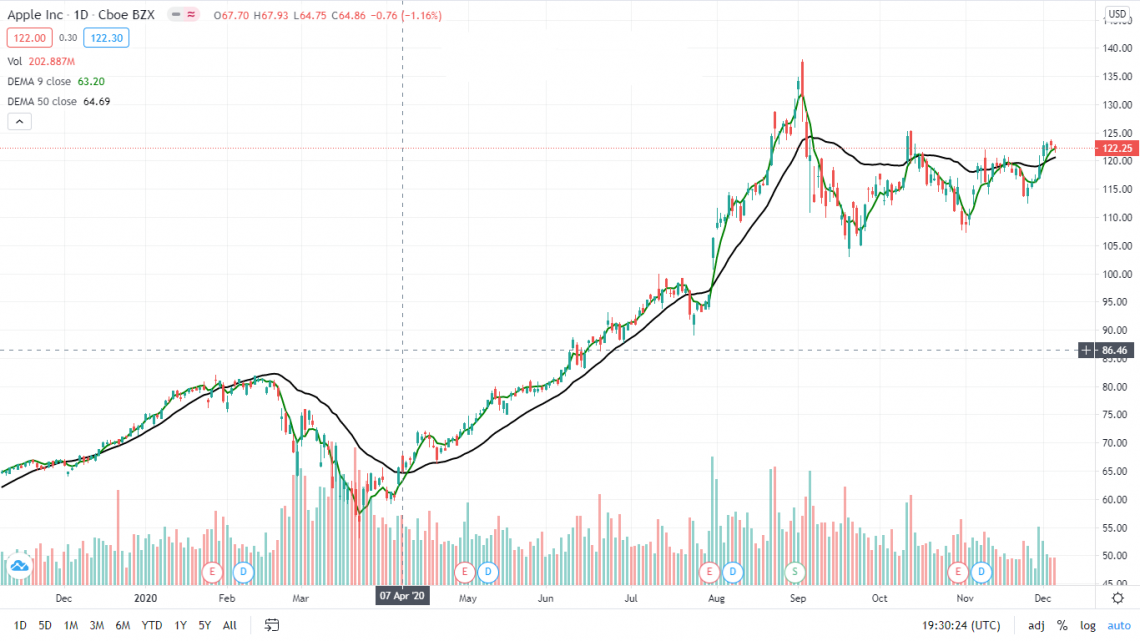
The black line is the 50-day DEMA, detached from the stock prices, compared to the green line, which is the 9-day DEMA.
The moving averages are dependent on the last data point. The lower the number of days of the moving average, the effect of the previous data point will be higher.
It can be observed here that the lesser the number of days used in calculating the moving average, the higher the volatility of that moving average. Hence, DEMA will be more volatile over a few days and incorporate price changes more accurately.
DEMA interpretation
Interpreting the DEMA is very straightforward. When the asset price is above the DEMA and keeps rising, it signals an uptrend.
When the asset price is below the DEMA, and the DEMA keeps falling, it confirms a downtrend.
As noted above, some traders display two or more DEMAs with different lookback periods on a single chart. Trade signals can be generated when these lines cross.
For example, a trader may think of buying if a 50-period DEMA crosses above a 100-period DEMA or selling when the 50-period strikes back below the 100-period.
It can be less reliable in indicating potential support and resistance price points. To pinpoint possible support or resistance points, a trader viewing a DEMA should ensure that it has served this function in the past. If not, it likely will not in the future.
This particular moving average is more dependent on the last data point. The lower the number of days of the moving average, the effect of the previous data point will be higher.
This can be observed from the example in the previous heading that showed that the lesser the number of days used in calculating the moving average, the higher the volatility of that moving average.
Hence, it will be more volatile on a lower number of days and incorporate price changes more accurately.
DEMA users
DEMAs react faster than traditional moving averages, so their users are likelier to be swing traders or day traders. Long-term investors, who trade less frequently, may, more often than not, find a traditional moving average better for them.
These are primarily used to spot an upward or downward price trend and analyze its strength. Traders watch to see if the price will move above or below the DEMA. Some traders use multiple DEMAs with different lookback periods, watching for them to cross each other.
A DEMA can indicate price support or resistance like any other moving average. It can help identify a price point at which a trend will reverse or even pause.
The equation does not rely on a double exponential smoothing factor. Instead, the equation doubles the EMA but cancels the lag by subtracting a smoothed EMA.
Because of the complexity of this equation, DEMA calculations require more data than exponential moving average (EMA) calculations. Spreadsheets and technical charting software can help in easing calculations.
Day traders and swing traders most often use the DEMA. Most long-term investors are better off using a standard moving average (SMA).
Applications of the Double Exponential Moving Averages
DEMA is used similarly to a simple or exponential moving average. They can be used in the following ways:
1. Trend Analysis
Trend analysis refers to the use of the price movement of a historical asset to predict future movement. The direction signaled by the DEMA is the direction in which the asset prices are expected to move. A rising DEMA signifies a possible rising price, whereas a falling DEMA signifies a potential price drop.
The price point of an asset above the DEMA is likely to rise, and the price point below the DEMA is expected to fall. A falling price trend may reverse if the asset price moves above the DEMA.
Similarly, if the asset price falls below the DEMA, the price rise is expected to reverse, meaning prices may start to fall. Traders use these cues to go long or short of earning profits using directional trading strategies.
2. Support and Resistance
Another important use of DEMA is to show support and resistance levels for the stock prices. A resistance level indicates where the stock prices show inertia to go higher, whereas support levels indicate where stock prices are not likely to fall below.
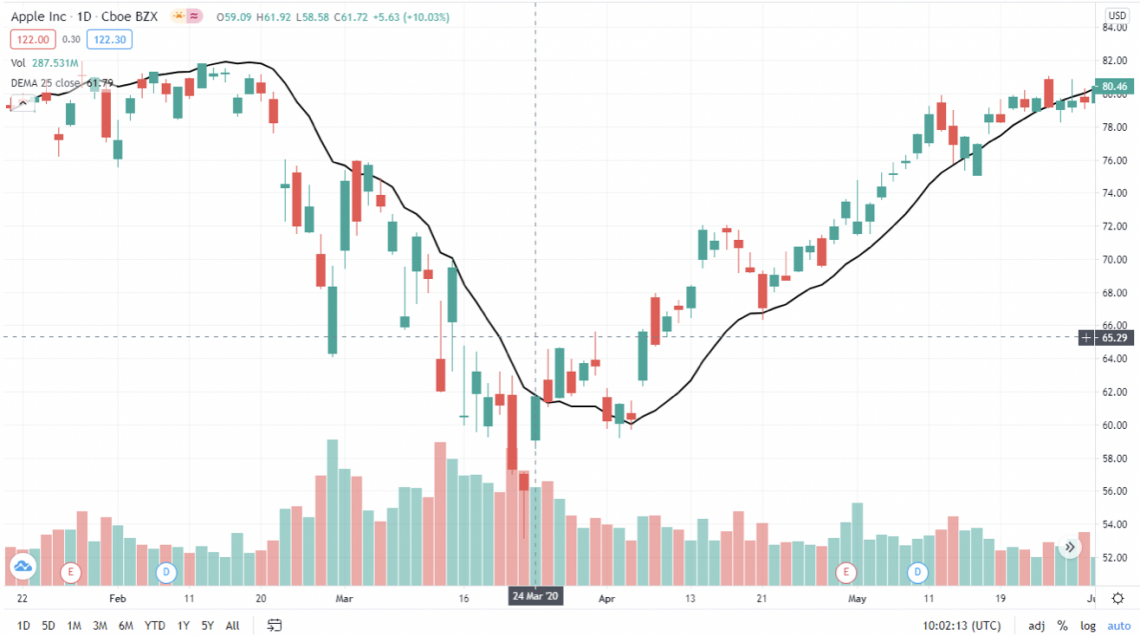
The graphs from Trading View show a 25-day DEMA line for Apple Inc. stock (AAPL) over approximately four months.
The first half shows that the candlesticks act as resistance. Once Apple’s stock price moves above the line around March 24th, the price does not fall below the DEMA line and now serves as the support.
The change of support and resistance where the stock prices move above the resistance is known as a breakout. A breakout is a vital trend reversal indicator regularly used by traders.
Double Exponential Moving Average (DEMA) Limitations
Moving averages can provide little insight when the asset price is choppy or range-bound. A reliable trend can not be identified at such times. The price will frequently go back and forth across the DEMA.
In addition, its strength is the ability to reduce lag, which can also be its weakness in some circumstances.
The reduced lag gets the trader out faster, therefore, reducing losses. However, reduced lag can encourage overtrading by providing way too many signals.
The indicator may inform the trader to sell when a minor move in price is observed, thus missing out on a more significant opportunity if the trend continues.
It is best used with other forms of analysis, such as fundamental and price action analysis.
Generally, the longer the term, the more accurate the indicator will be because the day-to-day "noise" of the markets diminishes over time. It also takes time for a trend to clarify.
The Triple EMA (TEMA) is an even more complex calculation involving an EMA of an EMA. The TEMA has even less lag than the DEMA.
Double Exponential Moving Average (DEMA) FAQs
The double exponential moving average can be described as a "smoothed" simple moving average (SMA).
A standard moving average displays a time lag that increases with the time being charted. The DEMA seeks to shorten this time lag to a consistent level.
Overall, it gives the trader an earlier warning of a possible change in an asset's price direction.
The accuracy of a moving average depends significantly on the length of the period being tracked. The most commonly used periods are 50-day, 100-day, and 200-day moving averages.
Generally, the longer the term, the more accurate the indicator will be because the day-to-day "noise" of the markets diminishes over time. It also takes time for a trend to clarify.
Like any other moving average, Double Exponential Moving Average is designed to trigger a buy or sell signal based on asset price movements over time. The buy or sell signal is triggered by a sustained change upwards or downwards in the asset's price.
As the names suggest, double EMA (exponential moving average) includes an EMA's EMA. The Triple EMA (TEMA) is an even more complex calculation involving an EMA of an EMA of an Ema.
The goal, ultimately, is to reduce lag. The TEMA has even less lag than the DEMA. A DEMA, or any other moving average, is likely more reliable if a more extended period is selected for tracking. Time diminishes the effect of "noise" in the markets.
The Moving Average Convergence/Divergence (MACD) indicator seeks to add greater insight to the moving averages by determining price movement.
MACD is calculated by subtracting the 26-period from the 12-period EMA. The result can help a trader determine whether a price trend appears to be gaining or losing strength. Some traders use MACD with the DEMA rather than a standard moving average.

Researched and authored by Rohan Kumar Singh | LinkedIn
Free Resources
To continue learning and advancing your career, check out these additional helpful WSO resources:


or Want to Sign up with your social account?