Stock Quote
The current market price of stock or equity of a publicly-traded corporation.


What is a Stock Quote?
Stock quote is the current market price of stock or equity of a publicly-traded corporation. A stock quote includes information like the bid and ask prices, last traded price, and trading volume.
All of this information that is provided under a stock quote facilitates catering to the investors to the current stock market activities.
When you search for stock online or view one through your brokerage, you will often see features such as previous close, dividend yield, and average volume.
These are all elements of a stock quote.
The price of a security on an exchange supplemented by an abundance of basic information can be crucial when making an investment decision. Quotes generally include around twenty statistics and are often accompanied by a graph of the stock’s performance.
The buyer bids to buy a security for a specified bid price, which is the highest they are willing to pay. On the other side, the seller lists the security for an asking price, which is the lowest they are willing to sell.
The difference between the bid and ask prices is the bid-ask price. A lower spread signifies that the stock is more liquid and demand is higher. Alternatively, when the spread is higher, there is typically less demand for the stock.
- A stock quote provides the latest market price information for a publicly traded stock. It includes data such as the bid and ask prices, last traded price, and trading volume, giving investors a snapshot of the stock's current market activity.
- The bid price is the highest price a buyer is willing to pay for a stock, while the ask price is the lowest price a seller is willing to accept. The difference between these prices is known as the bid-ask spread.
- This is the most recent price at which the stock was bought or sold. It is a key component of the stock quote and indicates the latest market valuation of the stock.
- Accurate and timely stock quotes are crucial for investors making buy or sell decisions. They help assess market conditions, set target prices, and manage investment portfolios effectively.
Understanding Stock Quotes
Purchasing stock allows any individual to own a small portion of the publicly traded company. An important feature of the stock market is that anyone can buy and sell stocks.
Investors can range in experience and knowledge. No single type of investor exists because an eight-year-old kid with a custodial account and a long-time Wall Street employee can buy and sell securities on the stock market.
As a result, basic information is easily accessible through stock quotes. Furthermore, these data points can be displayed in various periods such as hourly, daily, weekly, monthly, quarterly, annually, and even over longer intervals.
Information has historically been far more difficult to access because it could only be observed in newspapers and magazines. Now, electronic trading has revolutionized investing to make it more accessible and accurate.
Additionally, hundreds of publicly traded companies with stock prices change by the second, so stock quotes automatically update the most relevant information for investors.
Many websites offer delayed quotes for free, while some real-time quotes may require a subscription fee. Note that the information can vary slightly depending on the platform. Some of the most popular free websites are:
History of Stock Quotes
The first stock quotes were transmitted in early nineteenth-century France. The only information included in the quote was the price of the stock.
Ticker tape, invented in 1867, allowed stock quotes to be more detailed. This system was replaced in the 1960s by computers.
Before 2001, stock prices were quoted in fractions, while prices are now listed in decimal form. For example, a stock could be priced at 201/2, which would now be displayed as $20.50
This shifted the smallest bid-ask spread from 1/16th of a dollar ($0.0625) to $0.01. This saved investors money through smaller transaction costs because of tighter spreads.
Elements of a stock quote
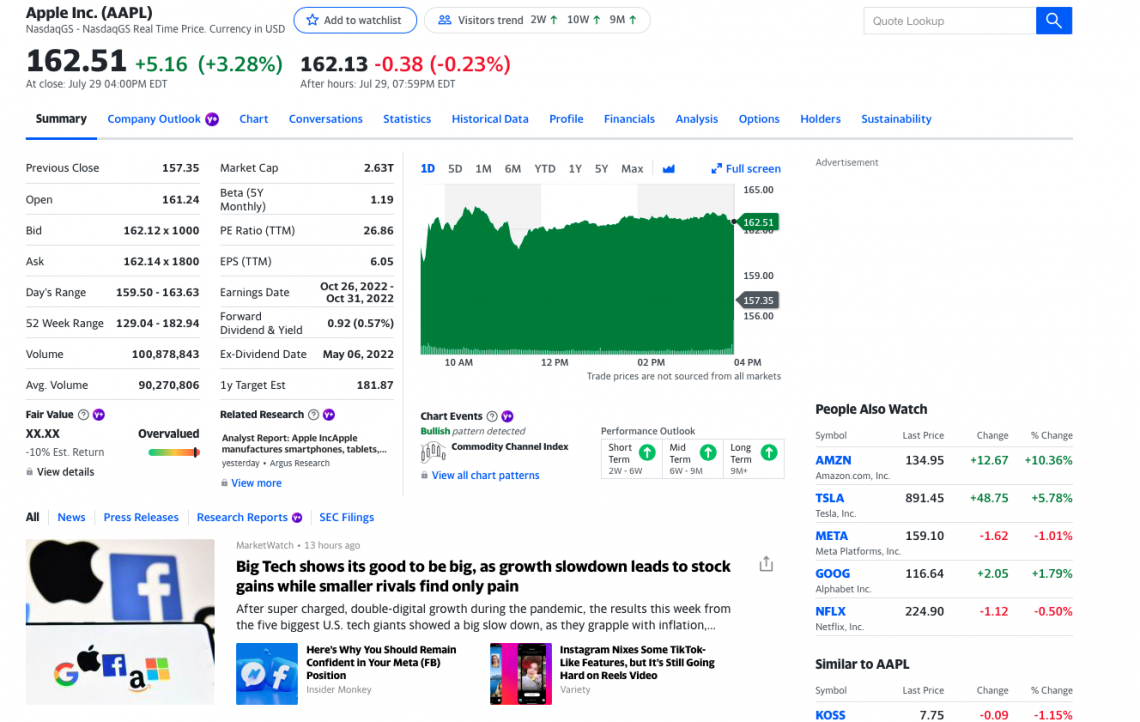
It includes an abundance of information and can be intimidating at first glance. Each element is detailed below, and the quote of Apple Inc. (AAPL) will be referenced for each term. Note that this quote is from Yahoo Finance after the market closed on July 30, 2022.
1. Company Name
This is simply the name of a publicly traded company. Some companies may have multiple classes of stocks. For instance, Berkshire Hathaway has two classes of stocks: Class A stock (BRK.A) and Class B stock (BRK.B). This quote is for Apple Inc.
2. Stock Symbol
This is also known as a company’s ticker symbol and often resembles the company name but in an abbreviated form. The stock symbol is up to the discretion of the company.
This symbol is easy to search for a stock you are looking for without typing the name because a ticker is unique to a company.
In this example, the ticker for Apple Inc. is AAPL.
3. Current Price
This is the price that you would pay or sell a security at. The price may be updated in real-time or delayed by around 20 minutes if the market is open. However, if the market is closed, then the price will represent the after-market or pre-market price.
The current after-hours price of Apple Inc. is 162.13 (because the screenshot was taken after the market closed). The price next to it, 162.51, is the price the stock closed at.
4. Previous Close
This was the stock’s price when the market closed the day prior. It is often used as a benchmark to compare price changes in the future. Note that this is not necessarily the price the stock will be at when the market opens the following day.
The previous close of Apple Inc. was 157.35.
5. Open
The open price was the stock’s price when the market opened that day. The open price often changes immediately as the market opens. Any difference between the close and open price is a result of after-market price fluctuations.
The open price of Apple Inc. was 161.24.
6. Bid
The bid price is how much the buyer is willing to pay for the stock.
The bid price of Apple Inc. is 162.12 x 1000. The number that follows the price is called the bid size, meaning there are 1,000 shares available to be bought at this price.
For example, if you attempted to buy 1,500 shares of AAPL at 162.12, it wouldn’t go through, as only 1,000 shares could be bought at this price. So to determine the bid price and size for the remaining shares, you need a Level II quote.
7. Ask
The asking price is how much the seller is willing to sell the stock.
The asking price of Apple Inc. is 162.14 x 1800. The number that follows the price is referred to as the ask size and means there are 1,800 shares available to be sold at this price.
The bid and ask sizes are constantly changing and determined by the stock’s supply and demand. In essence, the bid size is determined by buyers, and sellers determine the ask size.
8. Forward Dividend and Dividend Yield
The forward dividend estimates the dividend payout based on relevant data.
The forward dividend is calculated by annualizing the most recent dividend payout and dividing it by the stock price. This number is then multiplied by 100 to get the percentage.
In the screenshot above of Apple Inc., the forward dividend is 0.92. The dividend yield is the percent of the stock’s price paid out to stockholders each year as dividends or other disbursements. For example, a company with a
4% dividend yield and a current price of $100 are expected to pay $4 in dividends every quarter.
The dividend yield for Apple Inc. is 0.57%.
9. Day’s Range
This is the range of the lowest and highest price that a stock has been at for that particular day. This range can help determine if you are buying the stock at its highest price of the day or selling at its lowest. For example, the day range of Apple Inc. is 159.50 - 163.63.
10. 52-Week range
Like the day’s range, the 52-week range is the lowest and highest price a stock has been at over 52 weeks. This is also known as the year range.
This range can help determine if you are buying the stock at its highest price of the year or selling at its lowest. For example, the 52-week range of Apple Inc. is 129.04 - 182.94.
11. Volume
This depicts the number of shares that have been traded in a single day. If the volume is low, that stock may be more expensive and difficult to sell or purchase. Low-volume stocks are traded less often, while high-volume stocks are traded more often.
If the volume decreases, this is indicative of bearish trading. On the other hand, an increase in volume indicates bullish trading. However, other factors may be involved in these trends other than volume alone. The volume of Apple Inc. is 100,878,843 shares.
12. Average Volume
Like volume, average volume is the number of shares traded over a specified time interval. The average volume of Apple Inc. is 90,270,806.
In this example, more shares of AAPL were traded on this day than usual. Again, this is because the volume for the day was greater than the average volume.
13. Market Cap
Market cap is the total value of a publicly-traded company’s shares. The distinction between small, mid, and large-cap companies is:
- Small-cap: between $300 million and $2 billion
- Mid-cap: $2 and $10 billion
- Large-cap: $10+ billion
The market cap of Apple Inc. is 2.63T ($2.63 trillion). Therefore, AAPL is considered a large-cap stock.
14. Beta
Beta is a valuable number to gain an understanding of the volatility of the stock. The standard value is 1, considered to be the market’s volatility (such as the S&P 500 Index).
A beta value of more than 1 means the stock is more volatile than the market it is listed on. Conversely, a beta value of less than 1 means the stock is less volatile than the market.
So, if you are risk-averse, you may consider stocks with a beta of less than 1. For example, the beta of Apple Inc. is 1.19.
15. Price-to-Earnings Ratio (P/E)
This is the company’s share price ratio to its earnings per share. This is a primary method to determine if a stock is undervalued or overvalued. This value can be found by dividing share price by earnings per share.
The market ratio is between 20 and 25, so a value above 25 may be considered overvalued. However, this is not an absolute measurement of the value of a stock. For example, the P/E of Apple Inc. is 26.86.
16. Earnings Per Share (EPS)
EPS is a common measure of corporate profitability. A portion of a company’s profits is assigned to outstanding shares.
EPS is calculated by subtracting preferred dividends from a company’s net income. This value is then divided by the number of outstanding shares. The higher the EPS, the more profitable the company is.
Stocks with consistent earnings per share are more consistently making a profit. For example, the EPS of Apple Inc. is 6.05.
17. Ex-Dividend Date
This is the cutoff date to buy a stock in order to receive the dividend payment for that period. If you are looking to sell a stock but still want to receive the dividend payment, ensure that you don’t sell your shares until after this date.
The last ex-dividend date for Apple Inc. at the time of writing was August 4, 2022.
18. Earnings Date
This is often displayed as a range and gives investors an estimate of when the company will release its quarterly/annual financial reports and possibly hold its earnings call. For example, the upcoming earnings date range for Apple Inc. at the time of writing is October 26, 2022 - October 31, 2022.
Some other statistics that could be included in this but are not included in this example are:
19. Free Float
This value is the number of unrestricted shares of a stock that can be traded publicly. These are the total shares that the average investor can buy in the secondary market.
The calculation for free Float is:
Free Float = Outstanding Shares - Restricted Shares - Closely-Held Shares
20. Book Value Per Share (BVPS)
The book value of a stock considers the hypothetical where a company has paid off all of its liabilities and is liquidated. The book value is how much money would be paid to all shareholders.
Book value per share is calculated by:
BVPS = (Total Equity - Preferred Equity) / Total Shares Outstanding
Typically, the lower the company’s BVPS, the better the value of the stock.
This is a measurement of a company’s net cash flow that is allocated to each outstanding share.
The calculation for cash flow per share is:
Cash Flow Per Share = (Operating Cash Flow - Preferred Dividends) / Common Shares Outstanding.
The lower the cash flow per share, the better. Similar to the P/E ratio, a value less than 15 to 20 is considered good.
222 Year-to-Date Percentage Change (YTD% CHG)
Year-to-date means from the beginning of the calendar year to the current date. This is a measurement of how the stock has changed since January 1.
Depending on the platform, there may also be a graph that displays the stock’s performance. This is a valuable tool for observing trends over various periods such as five days, six months, one year, and five years.
You can find additional information under the stock quotes, such as:
- News
- Press releases
- Research reports
- SEC Filings
- Stocks similar to the stock you are viewing
- Financials
- Company profile
Importance of Stock Quotes
The aforementioned elements can provide valuable insight into a stock. Investors purchase and hold stock in an effort to make money. This is why understanding the value of the stock at the time of purchase is important.
You want to buy a stock at a price that it can grow from instead of buying at an all-time high. However, investing comes with risk, and there is no guarantee that you can time the market in this fashion.
How you utilize the data given depends on your investing profile and current financial situation. For example, the beta value, a volatility indicator, maybe more important if you are risk-averse.
The current prices of stock represent the supply and demand of shares. Generally, the price of the stock increases as the demand increases. An increase in the stock price reflects optimism for future earnings.
On the other hand, if the stock price decreases, this typically represents a collective bearish perspective of the company.
The stock price will often change following the release of a company’s earnings report. All publicly traded companies must release this report addressing their performance and many other elements.
The accessibility of stock prices over specified periods enables investors to make informed decisions. For example, observing a monthly low could be an opportunity to buy, but the price could also keep declining.
You will likely need the company name or ticker symbol to execute a trade. This can be found in the stock quote.
It is also helpful to look at the stock’s price and multiply it by the number of shares you intend to purchase/sell to get a total amount. For example, if you intend on selling ten shares of a stock currently selling at $30.50 per share, you can expect to get around $305 when you sell.
Using a watchlist can be beneficial for tracking stock quotes over time.
If you use stock quotes of companies to compare stocks, ensure that you use the same platform. Also, remember that stock quotes are just one element of investing and the stock market is more complicated than a few data points.
Stock Quote FAQs
These quotes allow investors to analyze a summary of the stock, including historical prices, dividend yield, and many other features. Many websites provide this information, albeit slightly delayed (usually by around 20 minutes), for free.
You can reference these websites and create a watchlist to track stocks you are interested in.
In essence, quotes enable investors to make informed decisions that align with their investing profile.
First, it is important to note the time stamp of the quote because outdated information is not useful.
Looking at the day and year ranges of prices can be the most helpful and simple information to look at. This can provide insight into whether you are purchasing or selling the stock at a good time.
There is no single piece of information that can provide the best insight into whether you should execute a trade, but looking at the basic information and chart can be an excellent starting point.


Free Resources
To continue learning and advancing your career, check out these additional helpful WSO resources:


or Want to Sign up with your social account?