Internal Growth Rate (IGR)
It is the maximum rate at which a company can grow without issuing further finances.


What Is an Internal Growth Rate (IGR)?
The Internal Growth Rate is the maximum rate at which a company can grow without issuing further finances.
There are two main sources through which a company raises funds:
-
Equity - By issuing its shares, i.e., giving a stake in the business.
-
Debt - By borrowing money from bank loans, debentures, etc.
IGR assumes that retained earnings solely fund the company's operations.
It is the maximum level of business operations that can continue to grow and fund the firm. This level of growth can be reached by adding more product lines or expanding the existing ones.
It shows that if a company wants to reach the next growth stage beyond the current rate, it needs to raise additional funds.
It is an important appraisal for startups and small businesses as it measures the business's ability to increase sales and profit without issuing new debt or equity.
Through IGR, investors can determine whether or not the company's current potential fulfills its expectations.
This metric is also important for planning the future path of the company.
It is also known as the "operational growth rate" because it does not consider additional money from outside the business.
The one with a higher IGR is always preferred among the two firms.
Formula and Calculating IGR
Let's take a look at the formula to calculate the Internal Growth Rate (IGR):
Internal Growth Rate (IGR) = ROA.B/ [1- (ROA.B)]
Where:
- ROA = Return on Assets
- B = The Retention Ratio
Before calculating, one must determine the return on assets and the retention ratio.
Return on Assets is a financial ratio that shows how much income is generated from the assets invested in the business. In addition, it measures how efficiently a company uses its assets to generate revenue.
Return on Assets = Net Income/ Total Assets
Return on Assets can be calculated by extracting the net income from the income statement and dividing it by the total assets, which can either be directly taken from the balance sheet or calculated by adding total liabilities and shareholder’s equity.
Unlike Return on Equity, Return on Assets also considers the business's liability for knowing the company's efficiency.
At least theoretically, increasing the value of the assets increases the business's income, so return on assets is an important part of this formula.
The retention ratio is the percentage of earnings kept aside as retained earnings by the business.
The net income that a business keeps aside after paying dividends to its shareholders is known as retained earnings.
The retention ratio is the opposite of the dividend payout ratio, which is the proportion of net income paid out as dividends.
Retention Ratio = (Net Income - Dividends Distributed)/ Net Income
OR
Retention Ratio = Retained Earnings/ Net Income
The first formula involves taking the net income from the bottom of the income statement and subtracting the distributed dividend from it. The result is then divided by the net income.
The second formula divides the retained earnings by the company's net income, which can be obtained from the bottom of the income statement.
After calculating both ratios, the IGR can be calculated by the above-given formula.
Drivers of the Internal Growth Rate (IGR)
A company can improve its IGR by increasing its ROA and retention ratio. For this, it requires to implement the following efforts to expand its Internal Growth Rate:
1. Optimizing Existing Production Processes
Companies should regularly check their performance and look for more efficient ways to operate.
With technology changing daily, new opportunities, such as business automation, can increase efficiency and reduce costs. This means that resources can be used in a much more effective way.
Using efficient tools and processes has a positive impact on IGR.
2. Redesigning Existing Products
In today's fast-changing environment, products soon become outdated in features and no longer attract customers. By scanning the market and evaluating how the customer's demand has changed, companies can refresh their products to increase sales.
This leads to an increase in Return on Assets, increasing the Internal Growth Rate.
3. Eliminating Underperforming Product Lines
Every product that the company manufactures uses assets. Underperforming products use assets without giving back their fair share of the return. By removing these products, the associated assets can be put to better use, which leads to an increase in ROA.
4. Adding New Lines of Business
A business can introduce new products to generate growth. It can analyze its existing product and the market to find the most logical complementary product, as people will be more inclined to purchase it.
Also, similar products can share assets, which increases net income and, in turn, increases ROA.
What Does the Internal Growth Rate Show?
The Internal Growth Rate shows the maximum sales growth achieved with only the company's internal finances. It explains how the firm's existing resources can be used more efficiently and effectively to advance the business.
For example, a manufacturer can examine its production process to optimize machinery, equipment, and labor and minimize idle time to increase productivity.
It can also reduce its inventory in the warehouse to lessen the amount of cash tied up in inventory. The existing market share of the brand can be increased by improving brand recognition.
A new product line can also be added to the firm’s existing product base to generate sales and reduce market risk.
The company can also check its existing product line so that any loss-making product can be eliminated and resources can be utilized for more successful outcomes.
Internal Growth Rate vs. Sustainable Growth Rate
One term often confused with IGR is the Sustainable Growth Rate (SGR).
Unlike IGR, SGR refers to the growth rate that a firm can achieve without external financing while using the equity and debt just enough to maintain the current debt/equity ratio, i.e., external funding is allowed but only in proportion to maintain the existing capital structure.
The formulas of the IGR and SGR are similar, except that in SGR, the Return on Assets (ROA) is replaced by the Return on Equity (ROE).
SGR = (ROE * R)/ [(1 - ROE) * R]
Where:
- ROE = Return on Equity
- R = Retention Rate
Return on equity is a measure of financial performance that calculates how much income is generated with the shareholder’s funds of the company.
Return on Equity = Net Income/ Shareholder's Equity
As discussed earlier, the retention ratio is the percentage of earnings kept aside as retained earnings by the business.
Retention Ratio = (Net Income - Dividends Distributed)/ Net Income
OR
Retention Ratio = Retained Earnings/ Net IOncome
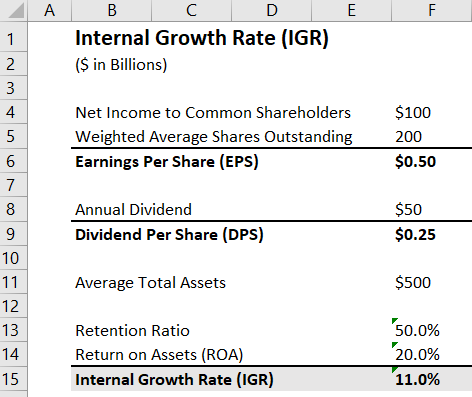
Internal Growth Rate Example
Suppose you have the following details about a company:
-
Net Income to Common Shareholders = $100 billion
-
Weighted Average Shares Outstanding = 200 billion
-
Annual dividend = $50 billion
Therefore, the Earnings Per Share (EPS) and Dividend Per Share (DPS) can be calculated as follows:
-
Earnings Per Share (EPS) = $100 billion ÷ 200 billion = $0.50
-
Dividend Per Share (DPS) = $50 billion ÷ 200 billion = $0.25
The retention ratio will be:
-
Retention Ratio = ($100 billion - $50 billion) ÷ $100 billion
Therefore, retention ratio = 50%
Alternatively, divide DPS by EPS and then subtract the result from 1.
-
Retention Ratio = 1 - (DPS ÷ EPS)
Therefore, retention ratio = 1 - ($0.25 ÷ 0.50) = 50%
Assume that the average total assets are $500 billion.
The Return on Assets (ROA) can be calculated by dividing the net income by the average total assets.
-
Return on Assets (ROA) = $100 billion ÷ $500 billion
Therefore, ROA = 20%
We can now calculate IGR using the formula discussed earlier.
Internal Growth Rate = (20% * 50%)/ [1 - (20% * 50%)]
Therefore, Internal Growth Rate = 11%
This 11% implies that the company can achieve a maximum of 11% growth without external financing.
Assumptions for calculation
Certain assumptions are taken for calculating the rate:
-
It assumes that everything in the business, like total assets, expenses, etc., grows at the same rate.
-
The dividend payout ratio should be as per the targeted rate.
-
Sales and assets are directly related, which means that an increase in sales would cause an increase in the assets of the company.
-
The company is not seeking any external financing in debt or equity.
-
All funding requirements are met from retained earnings to achieve the IGR.
-
Profit after Tax (PAT) should be directly proportional to the firm's revenue.
Internal Growth Rate (IGR) FAQs
Internal growth involves using the business's retained earnings to operate and drive growth. It is an organic way of growing the business.
On the other hand, external growth involves capital restructuring, debt financing, etc., to grow the business. Therefore, it is a faster way to grow than internal growth.
The internal growth rate demonstrates a company’s financial health and effectively forecasts how much a firm can grow without any external financing.
A business can also know when to raise more money from the market using this rate.
Yes, it is a percentage showing the rate at which the business can grow without external financing.


or Want to Sign up with your social account?