Unlevered Beta / Asset Beta
Understand the concept of Unlevered Beta and its significance in measuring a company's market risk without considering the impact of debt


What Is Unlevered Beta?
Unlevered beta is a metric that is used to measure the market risk of a company without taking into account the impact of its debt. On the other hand, levered beta is a measure that assesses a company’s market risk while including the impact of its debt.
Removing debt from the beta formula allows an analyst to understand the risk of a company’s assets. By eliminating the effects of financial leverage, they can more accurately estimate how a company’s assets are contributing to its risk profile. This is why unlevered beta is sometimes referred to as asset beta.
With levered beta, an analyst would estimate a company’s risk profile based on the combination of both the company’s debt and equity. This is why levered beta is sometimes referred to as equity beta.
When using levered beta to calculate risk it is important to remember that different companies maintain different capital structures.
- When comparing companies by their levered betas, an analyst may improperly evaluate risk due to the varying degrees of financial leverage taken on by each individual company.
- When researching a specific industry that requires a capital structure with a large amount of debt, levered beta may indicate that those companies are highly risky despite debt levels being relatively standard.
To find a company’s unlevered beta, an analyst must first have access to the following company information:
- Levered Beta: can be found through researching on financial websites such as Bloomberg or Yahoo Finance.
- Tax Rate: can be found by taking a company’s provision for income taxes and dividing it by the company’s pre tax profit.
- Debt to Equity Ratio: can be found by taking a company’s total liabilities and dividing it by total shareholder equity.
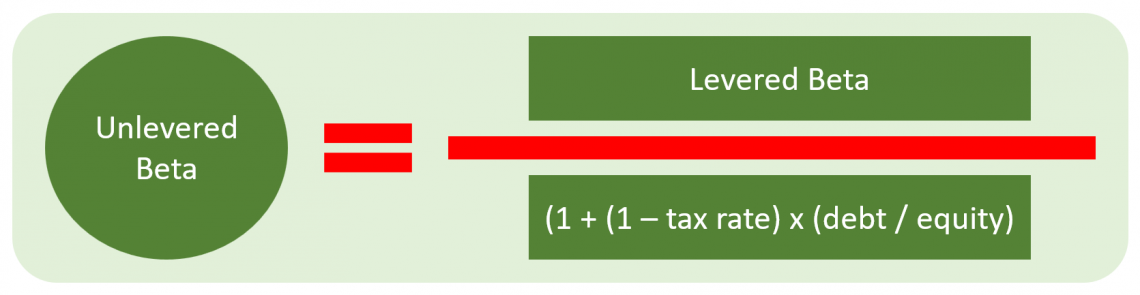
After we find these financial measures we plug them into this formula:
Unlevered Beta = Levered Beta / (1 + (1 - Tax Rate) x (Debt / Equity))
Here is an example of how the formula looks in Microsoft Excel
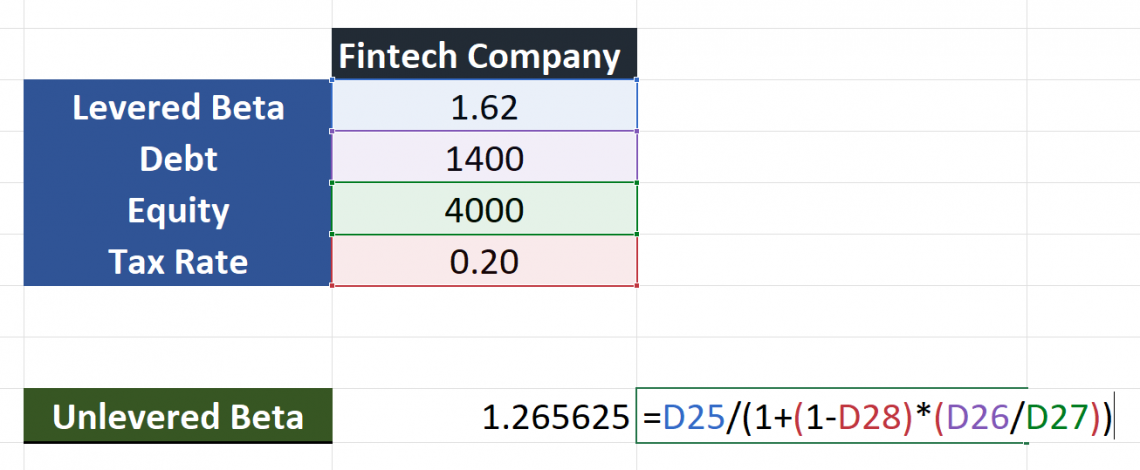
In the example above, we have a fintech company with a levered beta of 1.62, a tax rate of 20%, a debt of $1,400, and equity of $4,000.
To find the unlevered beta we use the following inputs in the calculation formula:
Fintech company unlevered beta = 1.62 / (1 + (1 - 20%) x ($1,400 / $4,000))
After executing this calculation we find that the fintech company’s unlevered beta is 1.26.
- Unlevered beta isolates a company's asset risk by excluding the impact of debt, providing a clearer understanding of its inherent market risk.
- Unlevered beta is derived from levered beta, tax rate, and debt-to-equity ratio, offering a formula to remove financial leverage effects.
- Beta measures stock volatility relative to the market; higher beta implies higher risk, while lower beta suggests lower risk.
- Examining three companies with varying capital structures showcases how unlevered beta reduces risk perception, providing valuable insights for comparisons.
- Unlevered beta aids in assessing a company's risk independently of its debt levels, preventing misinterpretation of increased risk solely due to higher debt.
Beta and Systematic Risk
Beta is a measure that allows analysts to compare the volatility of a given company’s shares against the overall stock market. Generally, the S&P 500 is used to represent the overall stock market within the formula for calculating beta. In more mathematical terms beta represents the slope of the coefficient for a company’s stock regressed against the overall stock market.
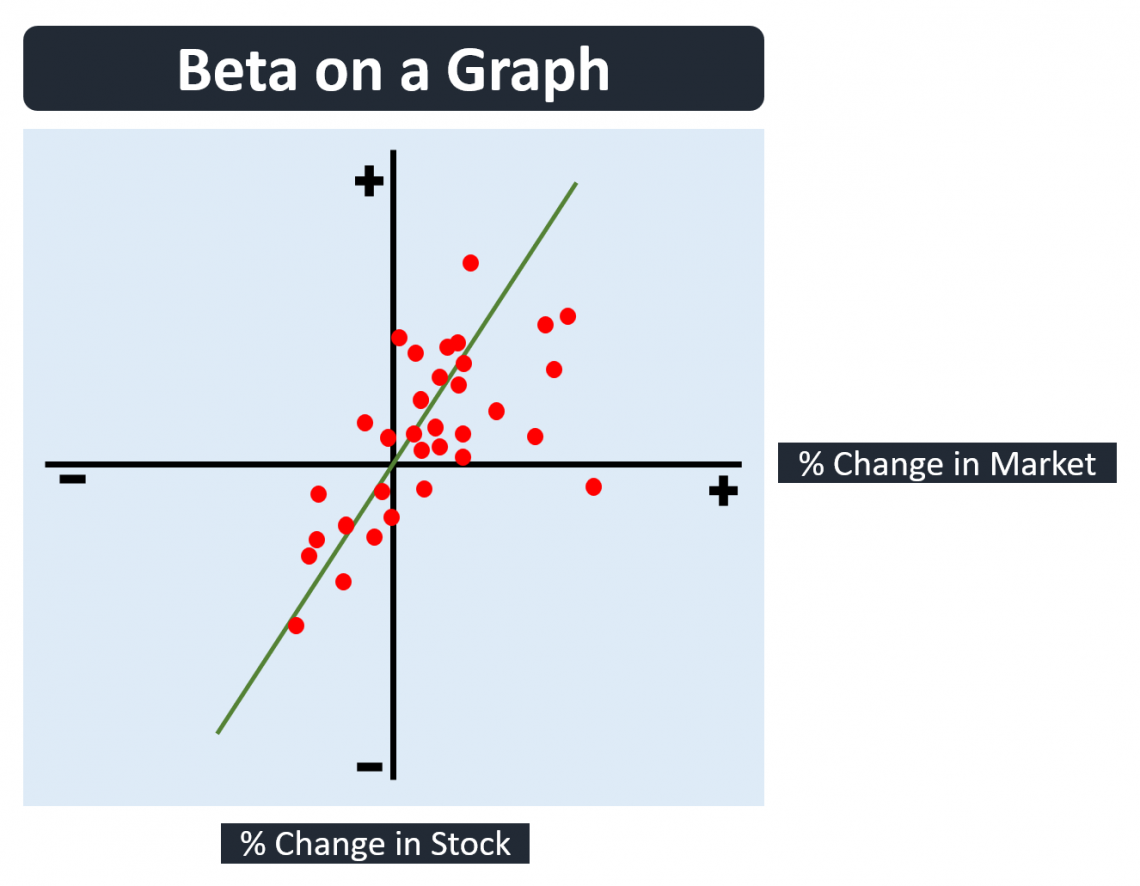
The more volatile a stock is, the higher its beta. Higher betas indicate a larger degree of risk. On the other hand, the less volatile a stock is the lower its beta. Lower betas indicate a lesser degree of risk.
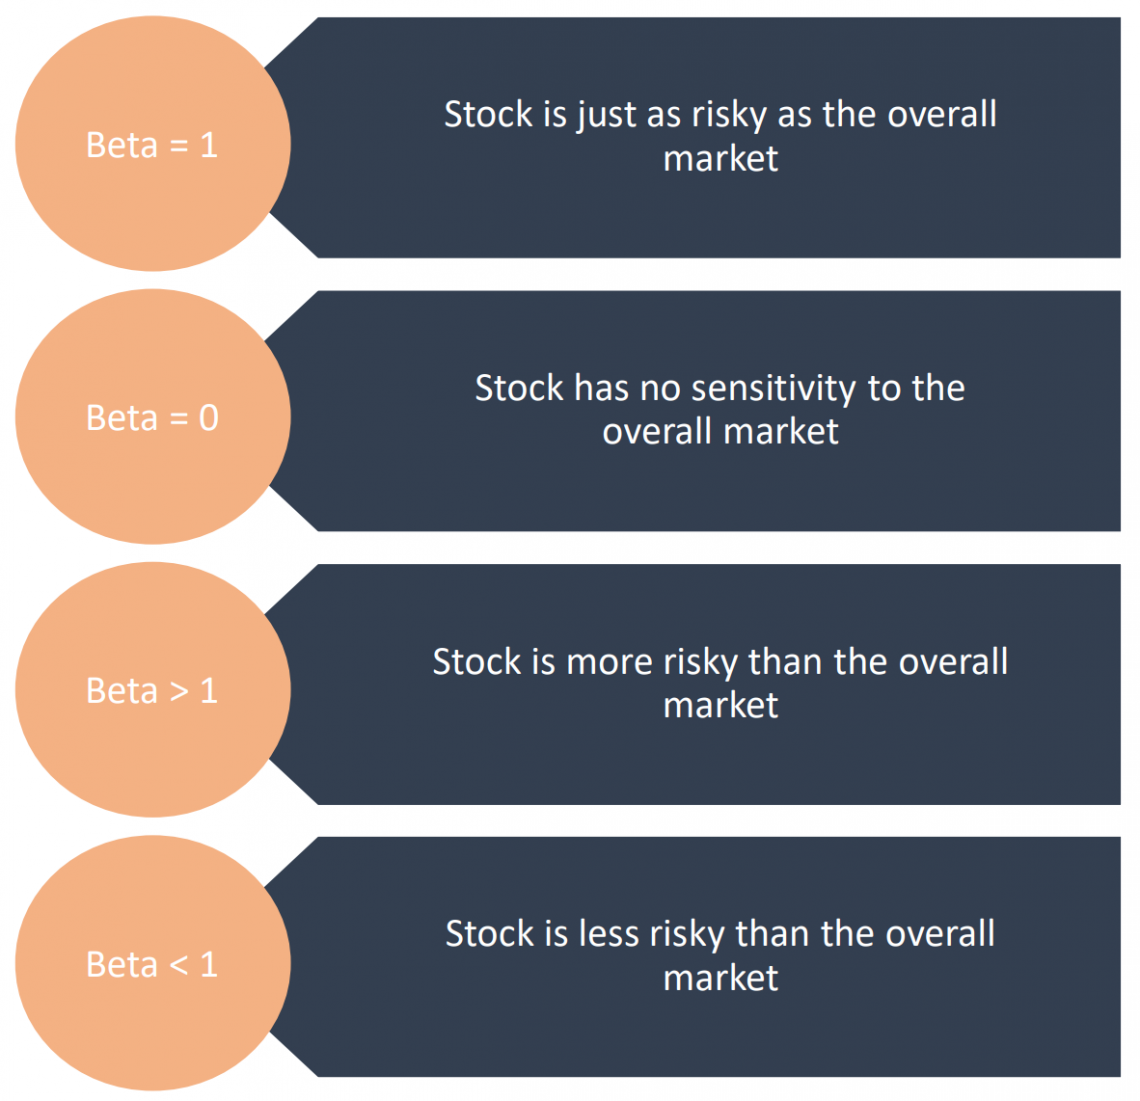
- When a company has a beta of one, its risk is considered to be equal to the risk of the broader market.
- When a company has a beta above one, its risk is considered to be higher than the risk of the broader market.
- When a company has a beta below one, its risk is considered to be lower than the risk of the broader market.
- When a company has a beta of zero, its risk is considered to be unassociated with the risk of the broader market
If a company was to have a beta of two, then the risk of its stock would be twice as risky as the overall stock market.
For example, let’s assume that Company ABC had a beta of 2. In this case, if the overall market was to appreciate by 5%, Company ABC’s value would appreciate by 10%
5% (Overall Market Advance) x 2.0 (Company ABC Beta) = 10%
The example above touches on the concept of systematic risk.
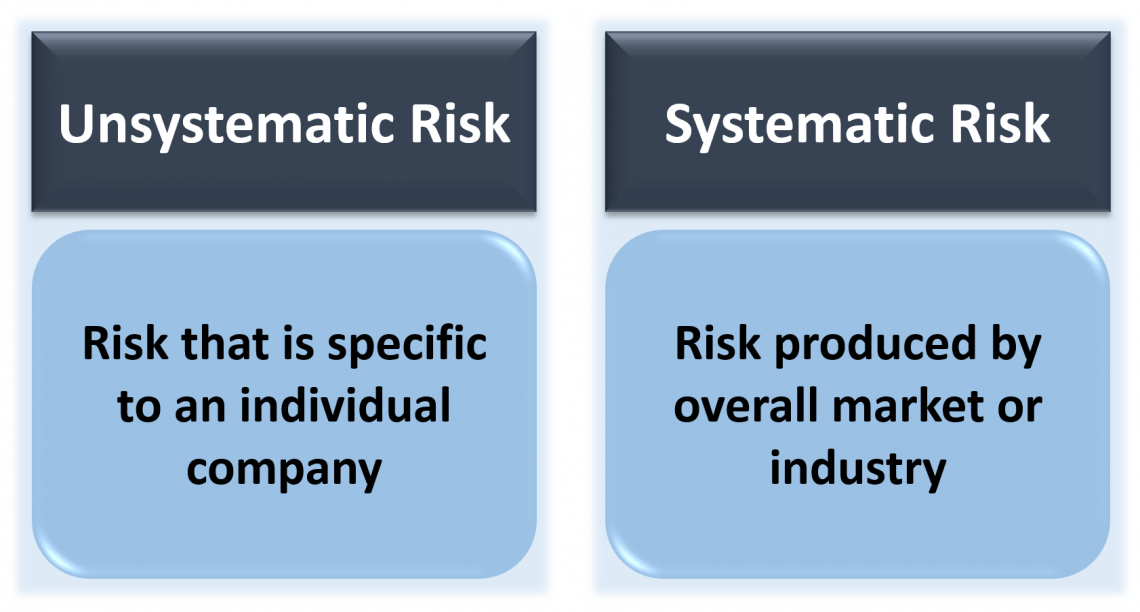
Systematic risk is the risk inherent in an individual stock due to the overall stock market’s risk. This type of risk may increase or decrease with changes in federal interest rates, economic expansions, and economic contractions. The systematic risk may also be referred to as market risk or undiversifiable risk.
On the other hand, unsystematic risk is the risk that is unique and specific to an individual company. This type of risk is separate from the overall market and can be difficult to quantify.
Example of Unlevered Beta
In this example we take a look at three companies with different capital structures, different levered betas, and the same tax rate of 20%.

The fintech company has a levered beta of 1.62, a debt of $1,400, and equity of $4,000. Using these as inputs to calculate the unlevered beta of the fintech company we find the result of 1.27. This allows us to understand the fintech company’s risk profile unaffected by its financial leverage.
As we can see, the beta is reduced which indicates that the company is less risky when we do not account for its debt.
1.62 / (1 + (1 - 20%) x ($1,400 / $4,000)) = 1.27
The social media company has a levered beta of 1.34, a debt of $1,000, and equity of $2,000. By unlevering the social media company’s beta we are able to find an unlevered beta of 1.18. By removing financial leverage the beta is reduced by 11.94%.
1.34 / (1 + (1 - 20%) x ($1,000 / $6,000)) = 1.18
The automobile company has a levered beta of 0.98 indicating that it is slightly less volatile than the overall stock market though only by 2%. When we unlever the automobile company’s beta we find that the unlevered beta is 0.74. By removing financial leverage the beta is reduced by 24%. This company’s unlevered beta is 26% less volatile than the overall stock market.
0.98 / (1 + (1 - 20%) x ($800 / $2,000)) = 0.74
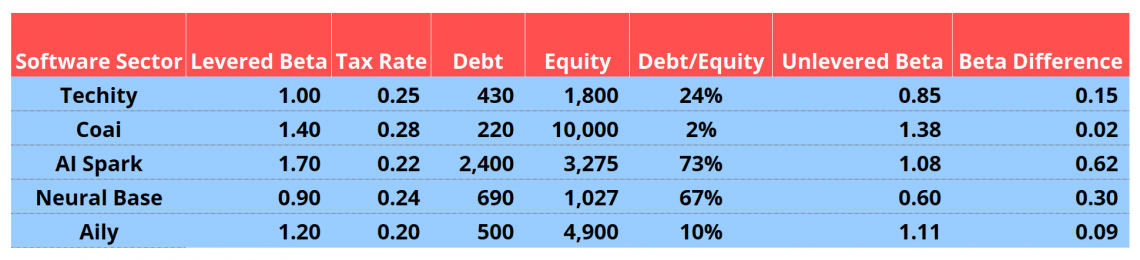
In this example, we take a look at using unlevered beta to compare different companies within the same sector. This specific example focuses on the software sector.
Of the five companies in this example, all of them have varying capital structures, different levered betas, different tax rates, and varying debt to equity ratios.
- When we unlever Coai’s beta, there is only a reduction of 0.02 or 1.429%. This is primarily due to its large amount of equity and low financial leverage. Coai’s debt to equity ratio is 2% resulting in the unlevered beta and levered beta being close to identical.
- When unlevering AI Spark’s beta, there is a massive reduction of 0.62 or 36.47%. This is primarily due to its large debt to equity ratio of 73%. When measuring AI Spark’s risk profile with debt and equity we find a beta that is 36% higher than when we measure AI Spark’s risk profile without debt.
Depending on a given company’s capital structure we may find a large reduction or little to no reduction.
Unlevered beta allows us to bring companies that are primarily financed via debt, companies primarily financed via equity, and companies that maintain a relatively similar balance of both equity and debt on an equal footing.
In the event that a company is financed entirely with equity and has no debt, then the levered beta and unlevered beta will be identical.
Why is unlevered beta important?
Unlevered beta allows you to assess the risk of a company’s stock without the effects of financial leverage. If a company were to take on more debt and thereby increase its debt to equity ratio it would result in an increased levered beta.
A higher beta would cause an analyst to assume that the company’s stock has become more risky relative to the overall stock market. In actuality the increase in beta exclusively represents the company’s increase in debt.
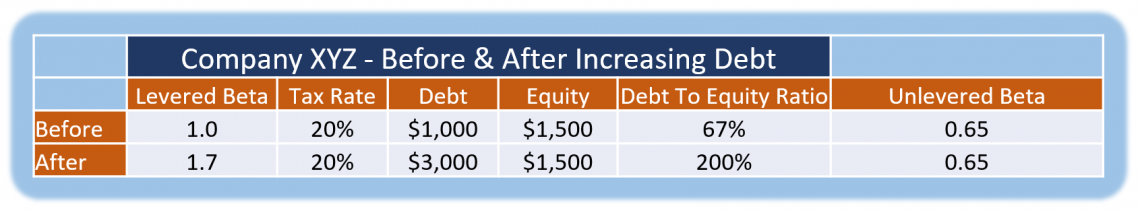
In the above example we see a before and after scenario for Company XYZ.
- Prior to taking on more debt, Company XYZ had a levered beta of 1.0 and an unlevered beta of 0.65. Company XYZ also had a 20% tax rate, $1,000 in total debt, and $1,500 in equity.
- After the company increased its financial leverage its levered beta rose to 1.7 despite its tax rate remaining at 20% and its equity remaining at $1,500.
- Through increasing the amount of debt on its balance sheet, Company XYZ went from being as risky as the overall stock market to 70% riskier than the overall stock market. This increase in risk is only measured by levered beta. Meanwhile unlevered beta stays the same at 0.65 both before and after.
This example illustrates why unlevered beta is important. By unlevering Company XYZ’s beta, we are able to see that the company's risk profile relative to the overall stock market has not changed. The company’s risk profile has changed exclusively due to an increase in risk that is specific to Company XYZ and not the overall market.
When a company increases the amount of debt on its balance sheet then the company becomes inherently riskier. The company will now have to allocate a larger amount of its cash flow towards servicing higher debt payments. While this does increase the company’s risk, the risk is entirely separate from market risk.
Unlevered beta allows us to understand whether a company’s risk profile has changed because of systematic risk or because of unsystematic risk.
Re-Levered Beta
The concept of re-levering beta was first proposed by Robert Hamada who is a Professor of Finance at the University of Chicago. Robert Hamada published his formula in the Journal of Finance in 1972, the paper was entitled, “The Effect of the Firm's Capital Structure on the Systematic Risk of Common Stocks”.
Hamada was able to identify how a company’s risk profile can fluctuate based upon its leverage. He proposed a formula for re-levering a company’s beta in order to more accurately compare it to competitors and peers. The formula is now called Hamada's Equation.
Hamada's equation allows analysts to distinguish between a company’s business risk and financial risk. Two theories are incorporated into the equation and those are the Capital Asset Pricing Model and the Modigliani Miller Theorem.
- The Capital Asset Pricing Model hypothesizes that investors expect to achieve a higher return when taking on a higher degree of systematic risk. This expectation derives from both the time value of money and the risk and return tradeoff.
- The Modigliani Miller Theorem hypothesizes that the value of a given company is both its present value of future cash flow and its assets. The value should exclude capital structure because it does not matter whether a company is financing via equity or debt.
Hamada’s Equation:
Levered Beta = Unlevered Beta x (1 + (1 - Tax Rate) x (Debt / Equity))
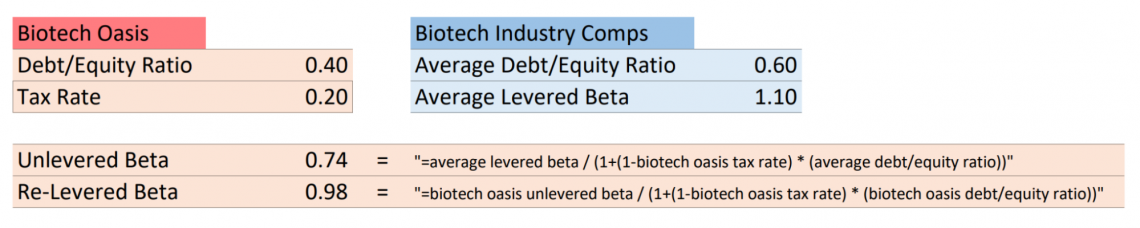
In the above example, we take a look at a biotech company called Biotech Oasis.
The average levered beta for the biotechnology industry is 1.10. The average debt to equity ratio is 0.60. These numbers in practice would be found through identifying a peer group for Biotech Oasis. Financial information from the peer group would then be averaged out in order to find the average levered beta and the average debt to equity ratio for the biotechnology industry.
First, we begin by deriving the unlevered beta:
0.74 = 1.10 / (1 + (1 - 20%) x (0.60))
Then we can re-lever the beta:
0.98 = 0.74 / (1 + (1 - 20%) x (0.40)
This equation allows analysts to make a company’s capital structure identical to the industry average and then extract a levered beta thereafter. An analyst may also choose to adjust a company’s capital structure to experiment with the different effects it will have on levered beta.
During the valuation process for a buyout, analysts may re-lever a company’s beta in order to test out various debt levels. This assists in the transaction process by helping prospective buyers find the best combination of debt payments, cash flow, and overall risk.

Free Resources
To continue learning and advancing your career, check out these additional helpful WSO resources:


or Want to Sign up with your social account?