In 1992, I had just finished a spreadsheet that contained the average PE ratios for companies in different sectors in the United States. There was little of substance in it, but I decided that since I had it, I might as well share it. I posted that spreadsheet for students in my class to download and made it available to others who visited my website (more hopeful thinking than an actual plan, since there were relatively few people looking for data online). Each year since, I have added to the data collection, initially expanding my list of data items for US companies, and in the last decade, adding to the collection by looking at non-US companies. It is my first task each year and it takes up the first week of the year, and I just uploaded the data today for the 2014 update.
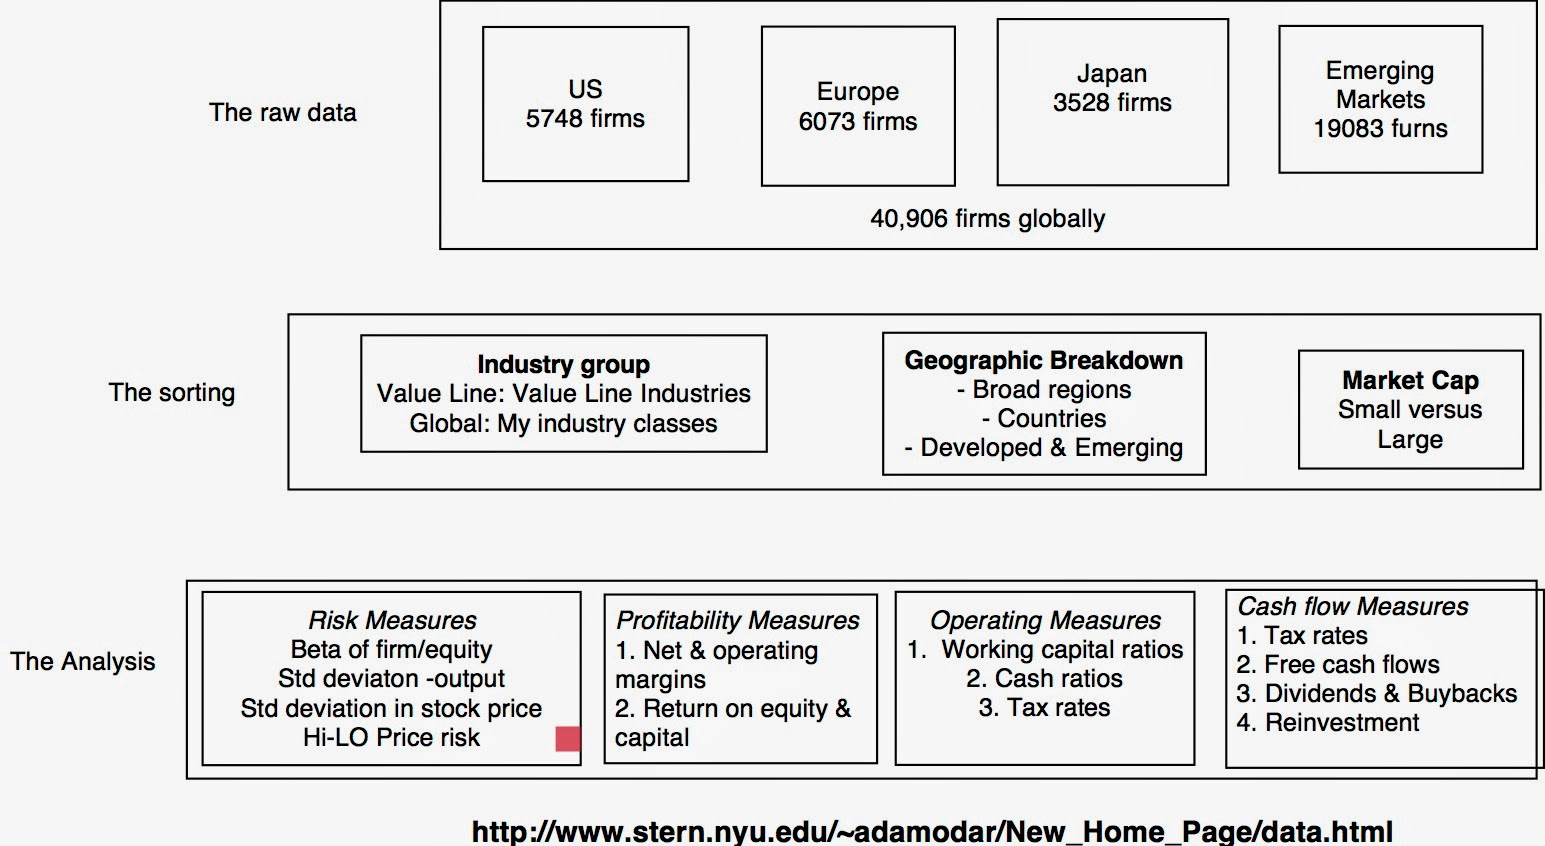
The “what”: It starts with raw data!
My focus in data analysis is to consolidate the data into a form where it not only less overwhelming but also more usable in valuation and corporate finance endeavors. To that effect, I compute averages on key statistics (profitability measures, risk measures and financial leverage measures) across industries and geographical groupings. I also use the raw data to put my spin on corporate finance measures (cost of capital, excess returns) for individual companies.
The why: It is purely self-interest!
- Anchor Angst: Behavioral economists, starting with Kahnemann and Tversky, have noted that investors and analysts look for anchors, starting points for making judgments, when making decision. They also noted that these anchors are often either skewed (by an investor's own experiences and history) or based on fiction, leading to bad decisions. So, what is a low PE ratio in today’s market or a high revenue multiple? Rather than make those judgments based on bad information, I find it useful to look at the data each year and let it inform my assessments. It is this theme that I used for my update last year, where I used one of my favorite books/movies, Moneyball, to illustrate the power of data.
- It
is a time saver: This may seem like an odd claim to make, after I have spent a
week collecting and processing the data, but I am convinced that the net effect of my efforts
during the last week will be a time saving over the course of the year. As some of you are aware, I not only teach a
valuation class but I also value companies frequently, both in the context of
the class and to satisfy my curiosity. While the starting data for my
valuations comes from the company’s financial statements, the key inputs in
valuation are often industry-wide risk and profitability measures. The industry
averages that I computed this week will often be the numbers that I return to
over and over again, during the course of this year. - Go
global: It is easy to talk “global” but it remains true that we are most
comfortable with staying “local”. This is not only true for investors, who continue to
have a home bias in investing (over investing in their domestic markets) but it also applies to businesses and academics. In fact, much of finance research, while
paying lip service to the global market, continues to have a US focus. One
reason that I have extended and deepened my analysis of global companies over time is to
fill in the empty spots in my knowledge on listed companies in many of the
smaller markets. It is telling that 80% of the time that I spent in the last week was on non-US data, a significant jump from the cursory efforts I made a decade ago when I started reporting global numbers.
that you will keep in mind:
- Data
can be subjective: Contrary to the widely held view that numbers are objective,
the statistics that you will see in my datasets reflect my judgments and points of
view, some of which you may agree with, but some that you may disagree with,
perhaps vehemently. Thus, my estimates of equity risk premiums for individual
countries are largely based upon sovereign ratings and CDS spreads, both bond
market measures of default risk. Similarly, my estimates of costs of capital
for individual companies are built on my estimates of relative risk (beta) for
these companies, which are in turn estimated from the sectors that they operate
in and their policies on debt. - Bludgeon,
not scalpel: One of the key differences between analyzing one company and
trying to assess tens of thousands of companies is that you cannot have too
much nuance in the estimation approaches that you use for the latter. For example, for an individual company, I will
try to estimate the cost of debt, based on an actual or synthetic bond rating.
With multitudes of companies, I use a much looser approximation, where I tie
the cost of debt to the variability in the stock price. Bottom line: If you are valuing an individual company, go to the source (the annual report and financial filings) and not the line data that you see for that company on my data set. If you are analyzing an entire sector, you can use my approximated data in your analysis. - There
will be mistakes in the raw data: I am incredibly grateful to Value Line,
Bloomberg and S&P for giving me access to the raw data on companies, but it is also true
that there is potential for human error at the date input stage. While I run my
own tests to try and catch data input errors , I will miss a
few. Thus, if you do find a company in my data base that has a return on equity
of 20,000% or a PE ratio of 0.1, odds are that there is something wrong in
the raw data of the company. - The
outlier conundrum: Even if the raw data is accurate, the ratios and multiples computed from that data can sometimes yield absurd values. Thus, the PE ratio for a company with earnings fading towards zero can converge on infinity. With individual companies, you notice these absurdities and either adjust for them or look for alternative statistics. With large samples, though, that oversight is again difficult and while I could have arbitrarily set limits (ignore PE ratios greater than 200, for instance), I was reluctant to put my imprint on the data. So, if you see strange numbers for some statistics, it is what came out of the data. - The
law of large numbers is your ally: The other side of large samples is a positive one, since the advantage of having very large samples is that the outliers have less of an impact on your statistics. Thus, I am comforted by knowing that I have hundreds of firms in each sector, when I compute my averages and that strange numbers on the part of a few companies will have only a small impact on the averages.
I know that there is little earth-shattering that I have said about what I learned from the 2014 data update, but I think those lessons will be better covered in a series of posts that I plan to make in the next couple of weeks.
P.S: As always, there are dozens of links and data sets in my data page and I am sure that I have screwed up on some of them. If you find any missing links or have issues with the data, please let me know and I will fix them as soon as I can.


I feel you are by far the mots valuable contributor. Thanks again for the input, will take a while to review later.
Very great job on this one Aswath. I'll look at the data and let know if there are some errors.
Thanks!
Very nice post. Great job
Intredasting
The Guru delivers once again
Professor Damodaran, you are the man. Thank you.
Do you believe that it's possible to consistently generate "alpha" through a strategy based on investing in undervalued assets and shorting overvalued assets? If I'm not mistaken, you spend a non-trivial amount of your time valuing various types of businesses, and at times you do invest money when you identify mispricings that offer a significant margin of safety. I'm curious how you reconcile those actions with the efficient market hypothesis, as I suspect that the discrepancy I perceive actually arises from my own misunderstanding of what EMH implies.
Molestias ex blanditiis sapiente natus et alias architecto. Cum quibusdam quod in dolores. Et ipsum error porro est perferendis ducimus.
Perferendis quos voluptatibus quasi quos et repellat harum est. Architecto eveniet corporis laudantium. Non molestiae et eligendi ratione aut odit exercitationem.
See All Comments - 100% Free
WSO depends on everyone being able to pitch in when they know something. Unlock with your email and get bonus: 6 financial modeling lessons free ($199 value)
or Unlock with your social account...