
Technical Question: How to identify quarterly D&A seperately on foreign issuer


Hi All,
Questions as I am in the process of forecasting PPE for a public Swiss company, which reports quarterly data.
The company (in their quarterly releases) reports only aggregate D&A. From my overpriced T20 MBA program, I've learned that Depreciation should equate (BOP PP&E + CAPEX - EOP PPE) and similarly for Amortization (BOP INTANGIBLES + INTANGIBLE PURCHASES - EOP INTANGIBLES) - when i input these they basically force the equation to equal the reported EOP balances, but are far off from reported D&A figures.
Can anyone elaborate on why this is? (is it simply some dep+amort is baked into other lines items and wouldn't be broken down?)
Any suggestions for forecasting PPE / Intagibles for a retail company that aggregates D&A together?
Calculations are in Below below, aggregate calculated D&A vs. Reported D&A is below - as noted, its a pretty big spread.
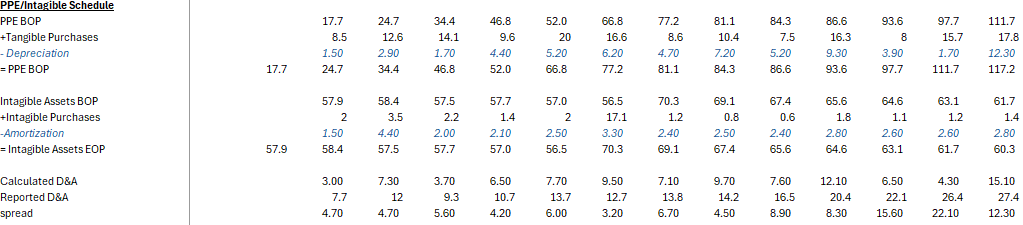
Thanks!






Based on the most helpful WSO content, here's what you need to know:
The discrepancy you're observing between your calculated D&A and the reported D&A figures could stem from several factors:
Non-linear Depreciation Methods: The company might be using accelerated depreciation methods (e.g., double-declining balance) or other non-linear methods that don't align with your straight-line assumptions. This would cause your calculated depreciation to deviate from the reported figures.
Impairments or Write-downs: Impairments or write-downs of PP&E or intangibles might be included in the reported D&A figures. These are non-recurring items that wouldn't be captured in your formula.
Foreign Exchange Adjustments: For a Swiss company, foreign exchange rate fluctuations could impact the reported balances of PP&E and intangibles, especially if assets are held in multiple currencies. This could create a mismatch between your calculated and reported figures.
Reclassifications or Aggregations: Some depreciation or amortization might be embedded in other line items, such as COGS or SG&A, and not explicitly broken out in the financials. This is common in retail companies where certain costs are allocated differently.
Suggestions for Forecasting PPE/Intangibles:
Use Historical Ratios: If the company consistently reports aggregate D&A, you can calculate historical D&A as a percentage of revenue or CapEx and use that ratio for forecasting. This is a simpler and often effective approach.
Detailed Schedule: If you want to go deeper, create a detailed schedule linked to CapEx and PP&E. Assume a useful life for new CapEx and waterfall the depreciation over time. This approach is covered in-depth in WSO's three-statement financial modeling course.
Management Guidance: Check if the company provides any guidance or notes in their filings about their depreciation policies or assumptions. This can help refine your model.
Industry Benchmarks: Compare with similar retail companies to see if their D&A ratios align with your assumptions. Retail companies often have unique asset structures (e.g., store leases, fixtures) that might influence depreciation.
If you're still stuck, consider revisiting the company's annual report or notes to the financial statements for more clarity on their accounting policies.
Sources: DCF Modeling Course ~ Pre-training text.pdf, Working in FIG (Financial Institutions Group) - An Overview., Write Down of PPE by 100, Bad team culture: A vent, Hardest Technical I've Gotten At a BB
What's the company?
There is lots of 'other' moving the PPE and intangibles around - sales of not fully depreciated assets and early asset retirements, impairments, and accounting estimate changes/error corrections. Depending on the company, there may also be some D or A running through other line items like COGS, SG&A, or other income and expense. Since your stated D&A is higher than what appears to be running through the accounts, you're probably missing additions to PP&E and intangibles.
If you model another company that reports D&A, you should do this analysis with the formula (BOP PP&E + capex - stated depreciation +/- plug = EOP PP&E) and see how big the plug is.
Thanks for insight, the company is 'ONON' ON Holding AG - i figured being a newer retail company D&A/PPE would be easy but am still scratching my head...It looks like their ROU Assets are depreciated so that may close the gap a little once added in.
Are you trying to go off only the face of the financial statements and skipping over the notes? The notes have a ton of depreciation details, much better than any of my US GAAP companies give. Check out the 20-F - compared to your numbers it looks like there is a difference mostly due to operating lease depreciation, plus a small restatement prior to 2022 (M&A in 2021 maybe?) and a small contribution from FX.
Post IFRS 16, there will be a depreciation expense for capitalized operating leases.
Non error inventore maxime qui aut. Hic dignissimos error odio necessitatibus aliquam a explicabo.
Enim voluptatem ad nam ducimus libero. Perferendis corporis vero alias veniam aut totam. Eum accusantium omnis soluta ipsam soluta totam incidunt.
Nesciunt perferendis dolorem occaecati eos rerum libero est aut. Consequatur molestiae iste magnam voluptatibus laudantium libero consequuntur. Quasi quisquam dolorem explicabo sequi est provident aut. Explicabo assumenda accusantium dolores nulla.
Dolores temporibus qui dolores asperiores ducimus aut. Ipsam qui unde autem qui enim illo officiis. Nihil ut molestias cumque. Consequatur in dolorem sint rerum aliquam laboriosam. Et aut labore numquam eaque. Rem qui quos rerum ea soluta ut quasi.
See All Comments - 100% Free
WSO depends on everyone being able to pitch in when they know something. Unlock with your email and get bonus: 6 financial modeling lessons free ($199 value)
or Unlock with your social account...