Maths Questions About L/S Relative Performance (More Complicated That It Initially Appears)
Would appreciate any help on the below maths problem relating to L/S performance.
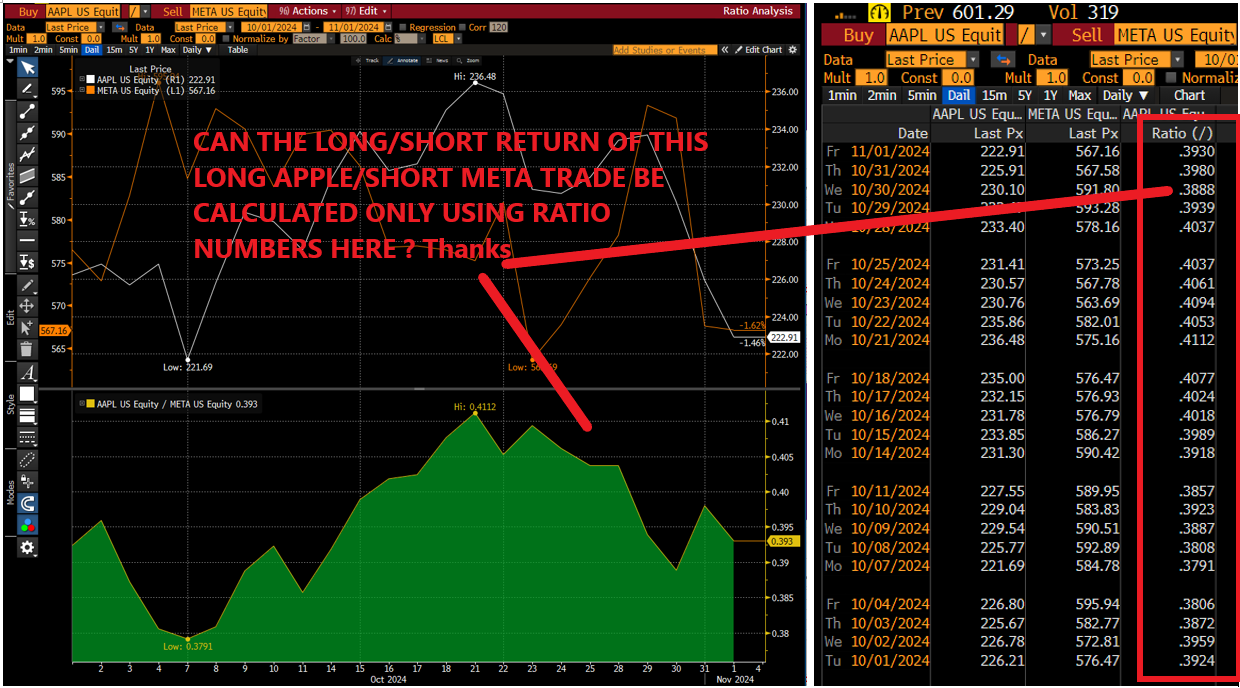
If we take a long/short equities pair.
Let's assume it is Long Apple/Short Meta.
On 1st Oct, stock prices were:
Apple: $226.21, Meta was $576.47.
On 1st Nov, stock prices were:
Apple: $222.91, Meta was $567.16
Now, obviously i know that the return on the long/short position over that period was [Apple Price Change of -1.4588%] - [Meta Price Change of -1.615%]=+0.1562%.
The question I have relates to if Bloomberg's GR function (which shows a ratio each day of the stock price of the long to the stock price of the short position) can calculate this same number.
I can't get my head around if this is a mathematically possibility or not.
Thanks.


It’s not possible to extract the percentage changes just using the ratio of the 2 stock values.
We can prove it by showing a counterexample with 2 different returns that have the same ratios. Take the following:
META (Day 1) = 2 | AAPL (Day 1) = 4 | Ratio =.5
META (Day 2) = 4 | AAPL (Day 2) = 2 | Ratio = 2
% return of long META / short AAPL:
(4-2)/(2) - (2-4)/(4) = +150%
Now for example 2 where ratios are the same but returns different:
META (Day 1) = 8 | AAPL (Day 1) = 16 | Ratio = .5
META (Day 2) = 4 | AAPL (Day 2) = 2 | Ratio = 2
% return of long META / short AAPL:
(4-8)/(8) - (2-16)/(16) = +37.5%
Two different returns where the ratios between the two in both periods are the same - this is what I believe you are asking lmk if this is wrong
I think it might be possible in the following case: both returns went the same direction in the period, and you have a portfolio that is equal weight both of the securities on a dollar basis
Short answer is no. You can't use ratios for exact returns.
The ratio method (price1/price2) inherently captures the relationship between the two prices in a non-linear way and gives a slightly different result - it involves cross-multiplication of the prices rather than simple percentage changes. Ratio calculates returns: (A2/M2 - A1/M1)/(A1/M1) = (A2M1 - A1M2)/(A1*M1).
You shouldn't use ratios for return calculations. You use it because a) it's easier to spot relationships visually than comparing separate percentage moves, b) price-relation breakdowns, c) convergences, d) historical context and statistical measures (e.g. standard deviations).
The 'traditional' simple return calculation (assuming equal notional exposure) is linear and measures simple percentage changes. (A2-A1)/A1 - (M2-M1)/M1. Even this isn't exactly correct if you wanna be Sheldon Cooper about it. Simple returns won't give you precise notational return. It's fine for being ~99.x% correct. So depends how exact you wish to be. But it does ignore compounding effects (often hidden in the decimals for shorter time horizons).
The actual relationship is (where R = Returns):
(1 + R1)(1 + R2)...(1 + Rn) = Pn/P0
Therefore, for precise long/short portfolio returns over multiple days, you need to either:
Now, again, these deltas between methods become small so we usually don't care. After all, most of us don't make investment decisions based on decimals (some might, idk), but it is probably the way it gets calculated in your Bloomberg Portfolio Function or OMS as multiple returns from multiple investors add up over time as things scale.
You'd face the same problem decomposing IRRs. IRR = Time adjusted return = Yield + Growth + Multiple Change. Adding up the total will show a slight difference to the separately calculated sum. This relates to how returns don't perfectly decompose or sum up due to cross-terms and interaction effects between different components. In other words, returns are "path dependent", where the sequence of intraperiod changes matters for the final result.
Simple math:

Real math:

Ut et doloremque neque ipsam id doloremque laudantium quam. Voluptate rem iure eum hic. Est veritatis ut tenetur dignissimos.
Ea id qui at illum id quia. Ut fugiat est dolorum doloremque nobis harum modi. Totam ratione accusantium rerum aut pariatur.
Voluptatem nihil tempora enim dolor aut est. Sit animi laborum assumenda veniam. Rerum nihil accusantium quia.
See All Comments - 100% Free
WSO depends on everyone being able to pitch in when they know something. Unlock with your email and get bonus: 6 financial modeling lessons free ($199 value)
or Unlock with your social account...