


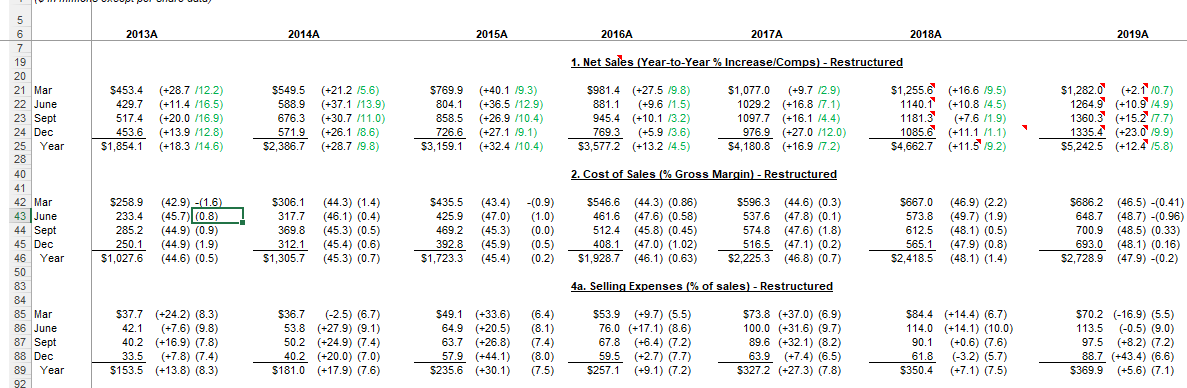
Random question - but why does the sell side sometimes model companies on that quarterly matrix instead of the typical left to right (ya know, the standard way)?
Dropped an example down here...
These are such a headache to look at... I understand you might want to look at the drivers QoQ... but it seems SO much harder to navigate and analyze this method. I can't really see much benefit to this method and it just seems like its way more time intensive to build. What am I missing?
Feel like you can always look at QoQ changes + comps in the traditional left to right flow?
Is this common at any buyside shops?
Trending Content - Hedge Fund Forum
| +21 | Future of L/S | 5 | 2d |
| +17 | Latest blow up / wind down | 25 | 2d |
| +15 | James Fishback | 7 | 9h |
| +12 | Looking for Fund to Partner With - LMM Activist | 4 | 6h |
| +10 | SM L/S Compensation? | 3 | 8h |
| +9 | Moving from credit to equity? | 3 | 4d |
| +9 | MMHF Central Execution Trajectory/Advice | 1 | 1d |
| +9 | How to prep for credit HF? | 4 | 1d |
| +4 | Jensen Huang | 1 | 1h |
| +3 | Chefs at Pod Shops | 2 | 3d |
Career Resources





I feel like it’s just to focus on seasonality.
I haven’t seen anyone model like this at any of the shops I’ve worked at (although all have been long-only shops with duration).
Seems like something that could be interesting to stare at. Do I do this, never, nor does anyone I know of. But I wouldn't be surprised if a random pod PM somewhere is making his grad associate do this for the coverage. A big part of sellside is just time/labor arb so even if 5% of their client finds this useful they are going to do it
Great point! If it’s going to get clients to look at their reports because it’s a differentiating factor (vs all the other commoditized sell-side research out there) for those who prefer the orientation over standard left-right, it makes sense for them to pander to a niche they can maintain.
Lmao is that Alex Straton in retail, if so I have always wondered this too. Borderline unreadable but she crafts really good theses
Est tempore vero beatae maxime est facilis est laudantium. Corrupti in odit qui debitis ut voluptatem sed quia. Voluptas alias aliquid incidunt quasi facilis est. Quis minima molestias quas non et. Iste saepe quod incidunt ea veniam harum aliquam. Animi esse reprehenderit eveniet voluptatibus amet est facilis numquam. Aut non rem quae doloremque debitis quibusdam.
Ea iure dolore et optio ad minus. Amet ex eum cumque.
See All Comments - 100% Free
WSO depends on everyone being able to pitch in when they know something. Unlock with your email and get bonus: 6 financial modeling lessons free ($199 value)
or Unlock with your social account...