Case Study: Risk Parity Mechanics During the "Efficiency Shock" Drawdown
The price action in the semiconductor sector this week—driven by the DeepSeek efficiency narrative—has provided a stress test for concentrated growth portfolios. While the Nasdaq-100 has experienced significant realized volatility, multi-asset strategies have behaved notably differently. A quantitative review of the current ray dalio portfolio structure offers a case study in how "All Weather" frameworks manage idiosyncratic sector risk.
Unlike the 60/40 model, which retains a high correlation to equity beta, Bridgewater’s allocation (based on latest 13F and public data) appears to have decoupled from the recent tech-driven drawdown. The resilience is not a function of predictive market timing, but rather a mechanical result of asset class diversification and volatility targeting.
1. Correlation Breakdown: Gold vs. Silicon
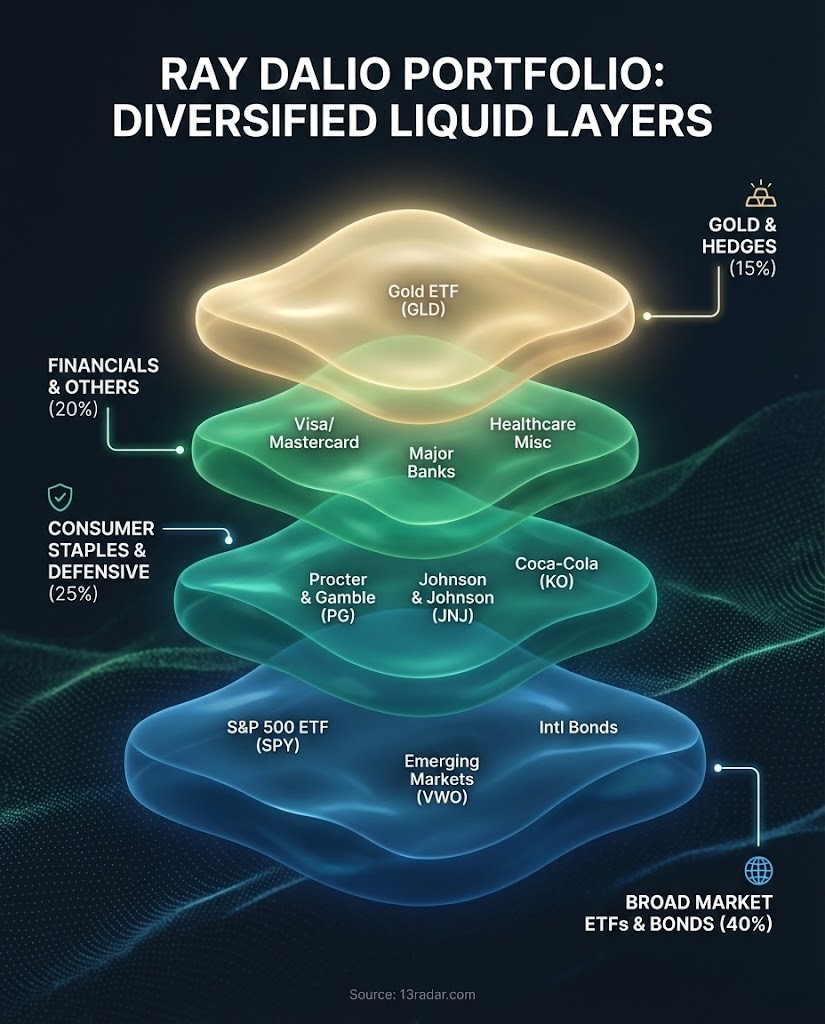
The most distinct feature of the current allocation is the substantial weighting in non-equity correlated assets, specifically Gold (GLD) and Emerging Market debt proxies. In the past 48 hours, as US hardware stocks faced a deflationary repricing, these asset classes have exhibited near-zero or negative correlation to the S&P 500.
From a portfolio construction perspective, this validates the "Holy Grail" concept of combining uncorrelated return streams. The capital flows suggest a rotation from "growth-at-any-price" (Tech) to "store-of-value" assets, allowing the portfolio to mitigate the equity drawdown without moving entirely to cash.
>>> QUANT NOTE: The "Low Beta" Anomaly
Observing the Factor Rotation during the crash:
- Momentum Factor (Tech): Severe underperformance (-2.5σ move).
- Low Volatility Factor (Staples): Significant outperformance. Top Bridgewater holdings like Procter & Gamble (PG) and Johnson & Johnson (JNJ) acted as equity bond-proxies.
- Takeaway: The portfolio captured the flight-to-safety bid within equities, offsetting the beta drag from broader market exposure.
2. Geographic Agnosticism
While domestic fund managers grapple with the "Mag 7" concentration risk, the Bridgewater filings indicate a persistent exposure to international markets, including China. Despite the narrative headwinds, valuations in these markets (Trading at 10x PE) offered a margin of safety that US Tech (Trading at >30x Sales) did not.
The recent divergence between the CSI 300 and the Nasdaq suggests that the "Geopolitical Risk Premium" may have been overpriced in the East and underpriced in the West. The portfolio's performance during this correction highlights the utility of geographic diversification as a hedge against single-country policy or sector shocks.
3. Mechanical Rebalancing
The "Risk Parity" approach operates on the assumption that asset classes will perform differently across economic environments (Growth vs. Inflation). The current market environment—characterized by fears of "Tech Deflation"—triggers automatic rebalancing.
As volatility (VIX) spikes in the equity tranches, the model theoretically trims high-volatility exposure and reallocates to lower-volatility instruments (like short-duration Treasuries or TIPS). This creates a "concave" return profile during crashes, dampening the drawdown speed compared to a standard long-only equity fund.
Discussion: Are other Macro funds seeing similar rotation flows out of Semi-conductors into defensive sectors, or is this viewed as a short-term buying opportunity?


