It’s easy to forget that the stock market doesn’t always go up. For many Millennials and Gen-Z investors, a secular bull market has defined their entire investing experience. But attitudes toward stocks, investing, and the future can shift quickly when markets stop hitting new all-time highs.
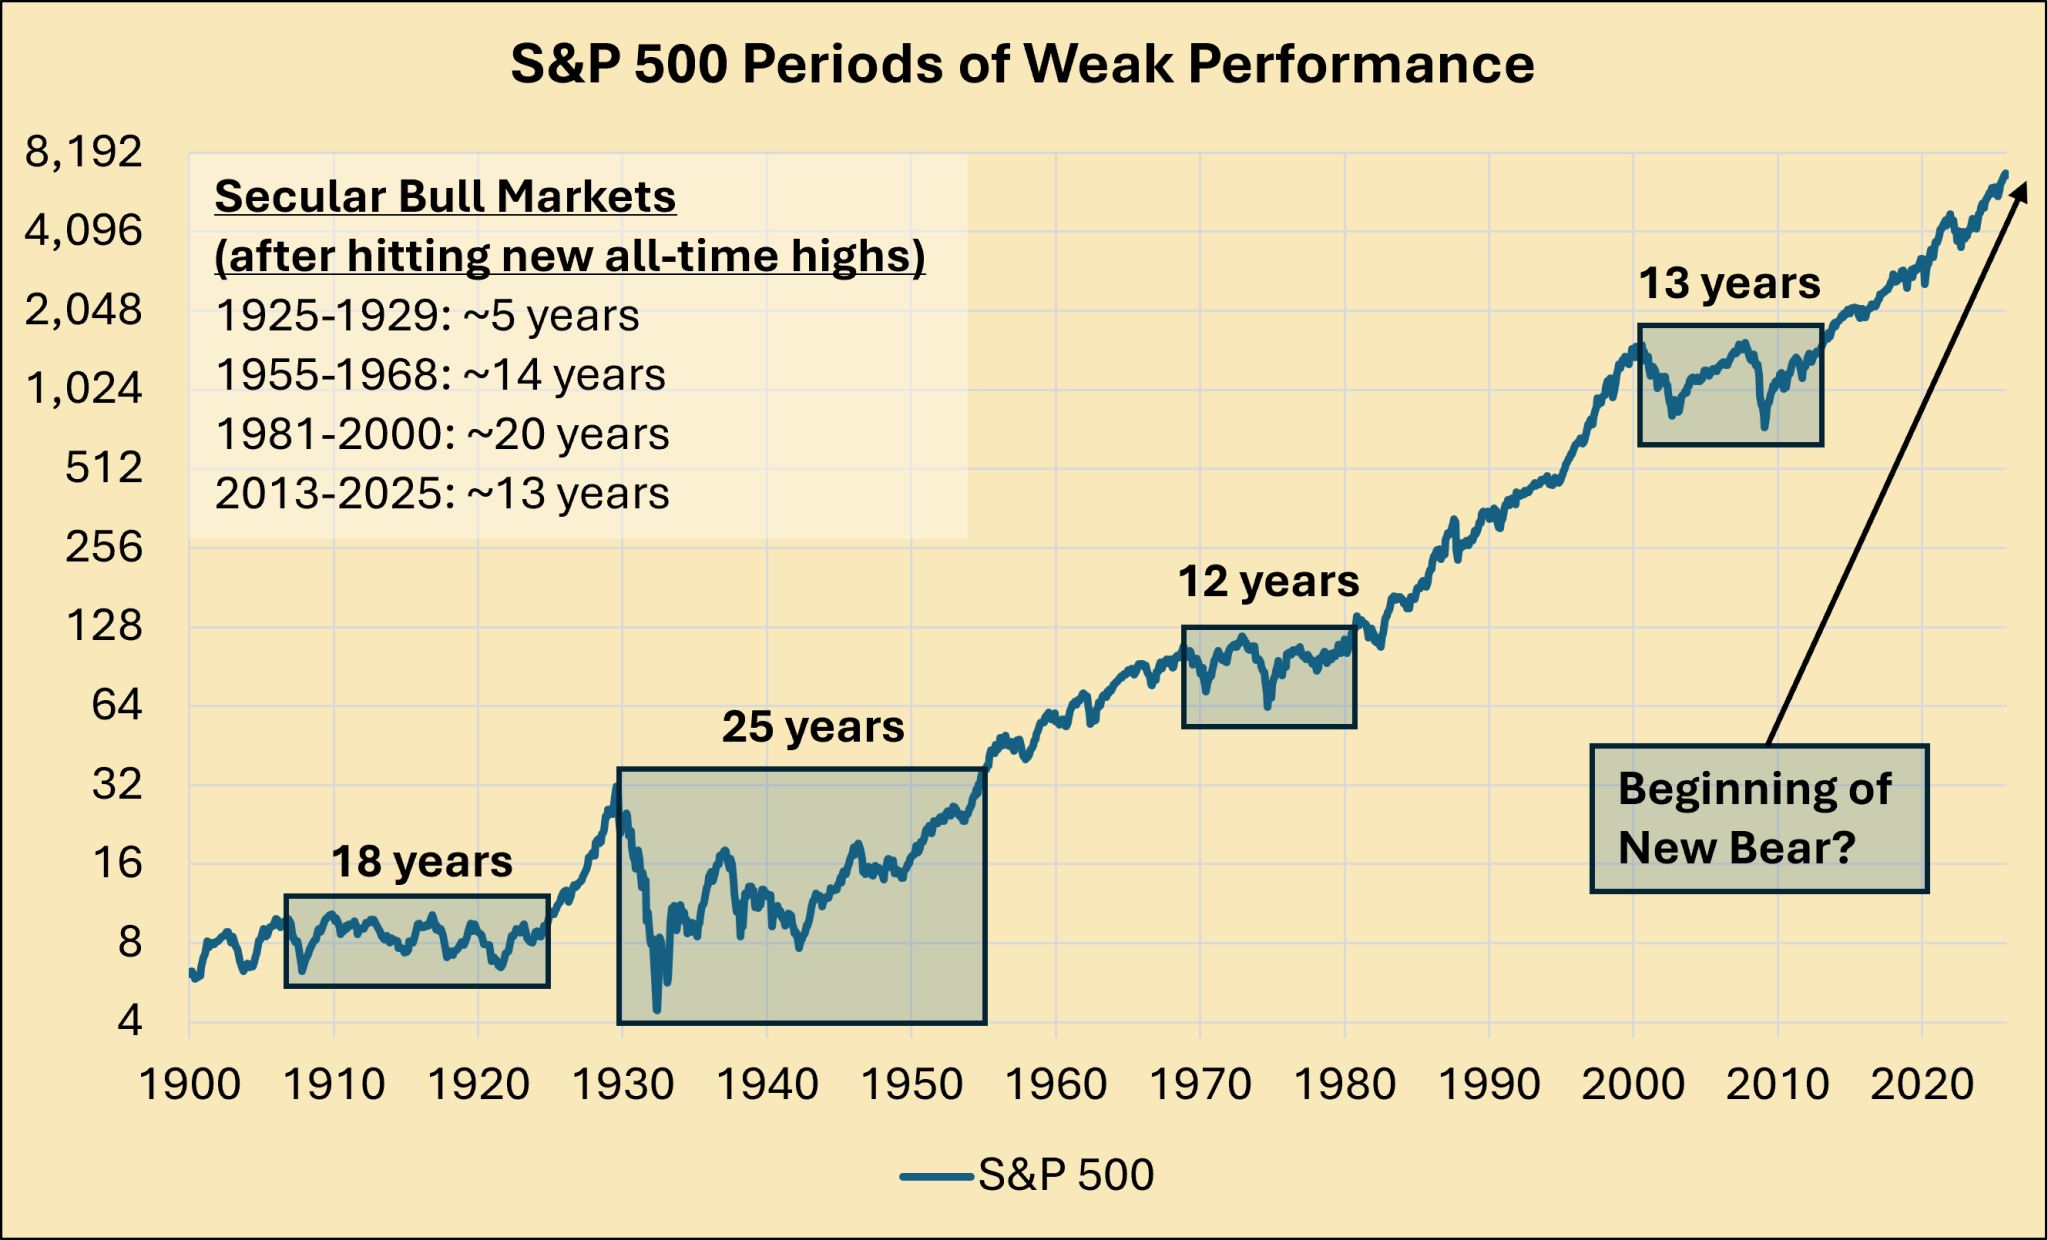
The chart below highlights four periods since 1900 when this happened. Over the past 125 years, stocks spent roughly 68 years moving sideways or down — about half the time “stonks only go up” and half the time they don’t.
Could the market keep rising? Certainly. The 1981–2000 bull market lasted 20 years, and the current one is “only” 13 years old (measured from the last new all-time high). Missing the last 7 years before the dot-com peak still meant portfolio losses.
But today is different from the mid-1990s. Back then, unemployment was falling, the tech mania had yet to hit, and the Shiller PE was around 20. Now, we have a weakening labor market and a speculative AI frenzy, with even top leaders like Sundar Pichai and Sam Altman warning of irrational behavior and overbuilding. The Shiller PE today is about 40.
When the AI bubble bursts, there’s a strong case that we could be entering a secular bear market.


Thanks ChatGPT
My original prompt below lol 👇
.
This is a stupid analysis. Literally just picking tops and pointing out how long it takes to recover. Yes, if you buy at the peak it will take a long time to get back to that peak. There’s nothing “secular” about a random decade. If you want to talk secular trends, check out long term interest rates. There’s a theory that those cycles run 40 years. If so, we may be at the end of one cycle (where interest rates gradually declined over 40yrs) and the beginning of another (where they go up for the next 40). That would certainly be bad for the S&P. Regardless, I wouldn’t put a dime of my own money in this crazy market. I don’t care how high it goes; I’ll wait for the inevitable cataclysmic crash, which I can’t imagine is far away.
Thanks for sharing your perspective! I get where you’re coming from. I agree that defining “secular” purely by peaks and recoveries is overly simplistic, and long-term interest rate cycles are absolutely an important lens for thinking about structural trends. My goal with the post wasn’t to predict an exact timing or call a crash, but rather to highlight the different timeframes across history related to the assumption that “stocks always go up”. Investors should account for the possibility of an extended period where stocks struggle to reach new highs and plan accordingly, both in terms of portfolio construction and expectations for time horizons.
People have been saying stuff like this for a while. Not sure why its different this time
It's not :)
Me have low current consumption but high income. Me have excess cash. Me have good duration and me happy to lend excess cash for risky productive endeavours. Me thinks capital markets are roughly efficient. Me believes then lending cash commands in expectation a healthy return. Me ploughs money monthly into SPY.
Haha, love the succinct logic! Sounds like you’ve got the classic “high savings, patient, and capital-efficient” setup. Ploughing into SPY consistently is a solid way to capture the market’s long-term return, especially if you’re thinking in decades rather than months! My goal was to highlight that there are signs that soon there might be a period where patience will be tested and we might go years without a new all-time high. But with your duration and mindset, you’re well-positioned to ride it out!
Yeah, in some ways I am investing my unborn kids' inheritance at this stage given I want to leave generational wealth behind (infinite horizon as I will structure it so that none of my future idiotic descendants can blow it out).
If I don't end up having any kids this goes straight into the blow and hookers fund though.
Agree with the comment above this is an idiotic analysis: pick the peaks and see how long it takes to catch back up. In the meantime, if you zoom in we see a short term low and another rise. And if you zoom in on an hourly basis, you will again see highs and lows. Stocks go up and down - thanks
I hear you — and you’re right, the analysis is intentionally oversimplistic by focusing on the peaks and how long it takes to catch back up. The point wasn’t to provide a detailed trading strategy or minute-by-minute view, but to highlight a bigger-picture lesson: not everyone approaches the market with a balanced portfolio across different time horizons and with patience, like many commenters above and myself try to do. The goal was simply to make those who don’t have that type of planning in place more aware that there can be extended periods where markets struggle to reach new highs, and to encourage a long-term mindset.
Doloribus expedita odio maiores ut. Dolorem aut nisi ratione voluptates nisi ex. Ipsum illo modi ducimus maxime autem. Illo ipsa repudiandae est eaque aliquam. Cupiditate aut quisquam iste. Et et labore deserunt suscipit est reprehenderit laudantium.
See All Comments - 100% Free
WSO depends on everyone being able to pitch in when they know something. Unlock with your email and get bonus: 6 financial modeling lessons free ($199 value)
or Unlock with your social account...