Data Tables
Structured grids with rows and columns that methodically convey data.

What are Data Tables?
Data tables, characterized by their rows and columns, are widely used for structuring and presenting information in a well-organized format. They are frequently used to present information clearly and orderly in various sectors, including science, business, research, and data analysis.
The importance of data tables in today's information-driven environment cannot be overstated. These ostensibly straightforward grids of rows and columns act as the foundation for organized data.
Each column classifies and describes a certain attribute, whereas each row represents a unique piece of information. The seemingly unassuming cell at the intersection of a row and column holds the power to decipher, analyze, and extract knowledge.
They enable us to analyze data effectively by calculating, sorting, and filtering, turning data into insights that can be used, and establishing the groundwork for data visualization.
These tables are essential in various industries, including banking, healthcare, science, and marketing. They silently support the basis of well-informed decision-making and are the unsung heroes of data management.
- A data table in Excel is a powerful tool used for performing sensitivity analysis and exploring different scenarios by calculating multiple results based on varying input values.
- Data tables allow users to analyze how changing one or more input variables affects the results of a formula or calculation and are commonly used in financial modeling, project planning, and decision-making processes.
- By leveraging data tables effectively, users can gain valuable insights into the dynamics of their models and make more informed decisions in various fields, including finance, engineering, and business management.
- Data tables help users identify how sensitive the results are to changes in input variables and assess different scenarios by comparing the outcomes under various conditions.
How to create Excel Data Tables
Users can perform sensitivity analysis using Excel data tables by analyzing how changing input values affect generated results. One can create a data table in Microsoft Excel by setting up the worksheet with the pertinent formula.
Let us take a look at the different steps for creating a Data Table:
Step 1: Open Excel
Start up your computer and Microsoft Excel.
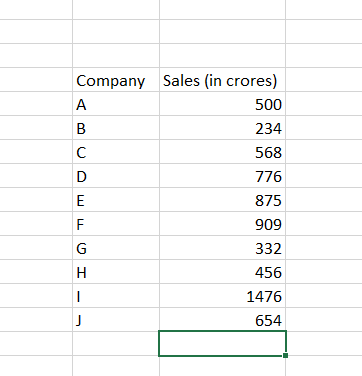
Step 2: Put Your Data in
Start entering your data into the spreadsheet. Each column should represent a distinct property or variable, and each row should represent a distinct data entry or observation.
Step 3: Format Your Data
Ensure your data is formatted correctly. For instance, format dates consistently, structure numerical data appropriately, and ensure all text is capitalized and written correctly.
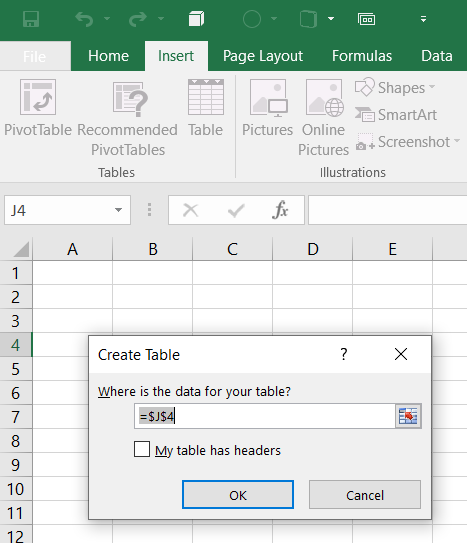
Step 4: Add a table
Select the cell range that contains your information. Your information table should include all the rows and columns you need.
Go to the "Insert" tab on the Excel ribbon and click the "Table" button. A dialogue box will appear.
If your information contains column headings, which is advised, make sure the "My table has headers" option is chosen within the dialogue box. These headers will serve as the column names in your information table in Excel.
Press "OK." Excel will make a formatted tab from the given data range.
Step 5: Use the data Table
Your data table is now ready for use and can be sorted, filtered, and utilized for data analysis, among other things.
- Sorting the Table's Data: To sort data by a column header, tap the drop-down arrow next to it. Select "Sort A to Z" to sort things in ascending order or "Sort Z to A" to sort things in descending order.
- Filtering the Table's Data: Click the filter symbol in the column header to filter a column. You can check or uncheck the items you want to include or exclude.
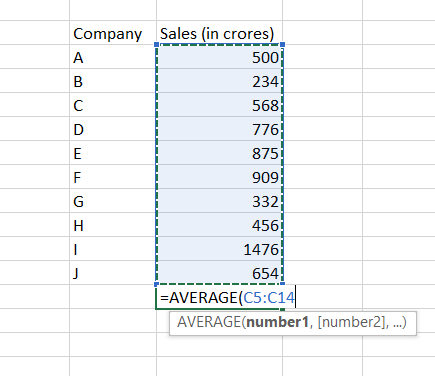
- Making calculations and totals (aggregations): Click the bottom cell of a column with numbers where you want your calculated result. There are several aggregation functions available, including SUM, AVERAGE, COUNT, etc.
Working with Data Tables
These strategies are crucial for understanding large datasets and drawing insightful inferences from your data. The important ideas we stated are described as follows:
1. Data sorting and filtering
- Sorting: It entails putting a data table's rows in a certain order based on the values of one or more columns. For instance, you can use ascending or descending order to arrange a list of sales transactions by date. Sorting makes it simpler to spot outliers, trends, and patterns.
- Data Filtering: Filtering allows you to see if the table's columns meet certain prerequisites. For instance, you can filter a list of products to show only those with a price above a certain threshold. You'll focus on particular characteristics of your information and filter out unnecessary data.
2. Aggregation and Calculations
- Calculations: You can make various calculations on the data in a column or between columns in a data table. For instance, in a sales dataset, you may determine the total income by multiplying the quantity sold by the price for each product.
- Aggregation: Aggregation is the process of combining data to produce a more comprehensive understanding. Calculating sums, averages, counts, minimums, and maximums are typical aggregation operations. For example, you can find the total sales revenue for a product category or the average score of students in a class.
3. Using Pivot Tables to Analyze Data
A pivot table is commonly used for data analysis and summarization in spreadsheet applications like Microsoft Excel or Google Sheets. By reorganizing and summarizing data from a conventional table, you can discover new information.
You can pivot or rotate data using pivot tables. You can select columns to act as row and column headers, condense data using aggregation methods, and create a new table that presents the data more easily.
For instance, you can use a pivot table to rapidly add up total sales per product in each region by month by taking a sales dataset with columns like "Product," "Region," "Date," and "Sales" and putting them in a table.
Recommendations for Creating Data Tables
Making a viable information table includes cautious arranging and planning to guarantee that the data is displayed clearly and is simple to get. Here are a few proposals for making information tables:
- Clear and Detailed Headings: Use column headings that succinctly and accurately summarize the content of each column. Avoid employing acronyms or abbreviations that everyone might not understand.
- Formatting consistently: For data items in the same column, use the same formatting. Use the same decimal places, monetary symbols, etc., for instance. Make sure the font sizes and styles are uniform throughout the table.
- Row shading alternative: Consider using alternating row shading (often known as zebra striping) to increase readability. This will simplify row navigation throughout the table.
- Do not merge cells: Cell merging should be avoided as it can make data analysis, sorting, and filtering more difficult. Instead, if necessary, use headings that span many columns.
- Keep Your Alignment in Mind: Align numerical data to the right for easy comparison and improved reading. Position text data to the left to make it easily scannable.
- Provide Legends and Abbreviations: If you use symbols or abbreviations, provide a caption or key explaining what each one means. If you're utilizing color coding, include a legend or key explaining what each color stands for.
- Limit Your Information: Avoid overloading the table with too many columns or extraneous data. Include only the most pertinent details to maintain clarity.
- Permit user interaction: Allow users to click on column headers to sort columns in digital tables in ascending or descending order. Create filtering options so people can view particular subsets of data.
Data Tables in Various Industries
Data tables are commonly used in various industries to organize and analyze data. These examples highlight how data tables can be effectively utilized to arrange and gather information from various types of data in various professional contexts.
Here are a few real-world cases of how information tables are connected in totally different areas:
- Finance
- Data from the stock market: Financial experts use tables to track and examine stock prices, trade volumes, and financial ratios over time. These tables help in making investment decisions and assessing market trends.
- Loan Amortisation Tables: To develop loan amortization schedules, which illustrate how monthly payments are allocated to principal and interest, banks and lenders employ data tables.
- Retail: Retailers utilize data tables to keep track of product names, quantities, reorder points, and inventory levels. They also use data tables to analyze sales data, including product sales by region, date, and shop and revenue data.
- Market analysis
- Consumer Surveys: Market researchers organize and analyze survey replies using data tables to gain insights into customer preferences.
- Competitive Analysis: Data tables are used by businesses to compare the qualities and costs of their goods and services to those of rivals.
- Environmental Science
- Climate Data: Environmental scientists utilize data tables to store and analyze climate data, such as temperature, precipitation, and atmospheric conditions.
- Ecosystem Monitoring: Data tables are used to monitor the health of ecosystems by tracking information on species populations and environmental variables.
Data Tables FAQs
An organized grid of columns and rows is called a data table, and it is used to arrange, display, and analyze data. Each column denotes a particular property or variable, whereas each row denotes a data entry or observation.
To manage and gather information systematically, Data Tables are mostly used in business, science, economics, research, web development, etc.
A table's rows are sorted by ascending or descending order according to the values in one or more columns. On the other hand, filtering temporarily hides all other rows and only exposes the rows that match certain criteria.
Consider adding pagination controls to divide huge tables into multiple pages. To assist users in concentrating on particular subsets of data, interactive sorting, and filtering features might be implemented.

Free Resources
To continue learning and advancing your career, check out these additional helpful WSO resources:


or Want to Sign up with your social account?