Nominal Gross Domestic Product
A crucial measure of economic output and GDP measurement that does not adjust for inflation.


What Is Nominal Gross Domestic Product (GDP)?
Nominal gross domestic product, also known as nominal GDP, is a key measure of economic output. Nominal GDP is a measurement of GDP that does not adjust for inflation.
There are a few different ways to approach measuring nominal GDP. These include the production approach, the expenditure approach, and the income approach. The following is a summary of how these three approaches calculate GDP:
-
The production approach calculates GDP by finding the total dollar amount of all goods and services produced.
-
The expenditure approach calculates GDP by finding purchasers’ total dollar amount spent on all goods and services.
-
The income approach calculates GDP by finding the total dollar amount of all income earned while producing these goods and services.
The fundamental identity of national income accounting is that the three of these should be equal. That is:
Total Production = Total Expenditure = Total Income
The exact definition of GDP depends on the approach used to calculate it.
- Nominal Gross Domestic Product (GDP) measures the total value of all goods and services produced within a country’s borders over a specific period, using current prices.
- Nominal GDP is the sum of the market values of all final goods and services produced in an economy during a specific period. It does not account for inflation or deflation, so it reflects the prices at the time of measurement.
- Nominal GDP is a key economic indicator used to gauge the overall economic activity and health of a country. It provides insights into the level of production and consumption within an economy.
- Inflation can cause nominal GDP to rise even if the volume of goods and services produced remains unchanged. This makes it important to consider inflation rates when interpreting nominal GDP figures.
Nominal GDP: The Production Approach
From a production standpoint, the definition of nominal GDP is the current market value of all final goods and services newly produced domestically in the economy within a certain period of time. This definition is quite specific, ensuring that the calculation is always consistent.
Because the gross domestic product is defined as the “market value,” it allows for easy calculation. Goods and services are included in GDP at their market sale price.
However, some goods do not have a market price. As a result, certain goods and services are not included, and others are added as imputed values (approximate estimates of the market value).
Clarifying “final goods and services” ensures that nothing is double-counted. So, for example, if the components used to build a car were counted in GDP, and then the full price of the vehicle was also counted, the intermediate goods would be counted twice.
We, therefore, define final goods and services as those sold for final use and not utilized merely as a part of the production process of another good or service.
For example, a glass phone screen would not count as a final good, but an iPhone would.
We can either calculate the final value by excluding intermediate goods and services or by summing the value added at each step of the production process. Using value-added automatically subtracts intermediate goods from the total.
The “newly produced” specification ensures that only goods produced in that period are included in the GDP calculation. For example, a good manufactured in 2019 and sold in 2020 would count towards 2019’s GDP.
The gross domestic product definition also includes the technicality of “domestically produced.” This means that only products within the geographical boundaries of the country in question are counted.
Finally, “within a certain period of time” clarifies that GDP represents a certain economic output amount during a period rather than at one moment.
nominal GDP: The Expenditure Approach
The expenditure approach has a definition quite similar to the production approach. In terms of expenditure, gross domestic product is the total dollar amount of spending on final goods and services produced domestically during a given period.
As we can see, this definition has the same caveats as the production approach. To calculate GDP from an expenditure perspective, we take into account the main categories of expenditure. These include:
- Consumption (C)
- Investment (I)
- Government purchases (G)
- Net exports (NX)
Together, these four components form the national income identity, where Y represents GDP.
Y = C + I + G + NX
The category of consumption includes spending on goods and services by households. This expenditure category can be further broken down into consumer durable goods, nondurable goods, and services.
The investment focuses on spending on capital goods (which are treated as fixed investments) and on inventory. This further breaks down into residential, nonresidential, and inventory investments.
Government purchases are essentially the equivalent of the consumption category but for governments instead of households. Government purchases include those by the federal, state/provincial, and local governments.
Government transfer payments (Tax returns, employment insurance, etc.) are not included in the government section of GDP, as nothing is exchanged in return for the government payments. In other words, the government is not purchasing anything.
The net export category focuses on the net change in the gross domestic product due to imports and exports. Exports are domestic goods purchased internationally, and imports are foreign goods purchased by domestic residents. We calculate net exports with the equation:
Net Exports = Exports - Imports
Together, all these components are added to form nominal GDP, as described in the national income identity.
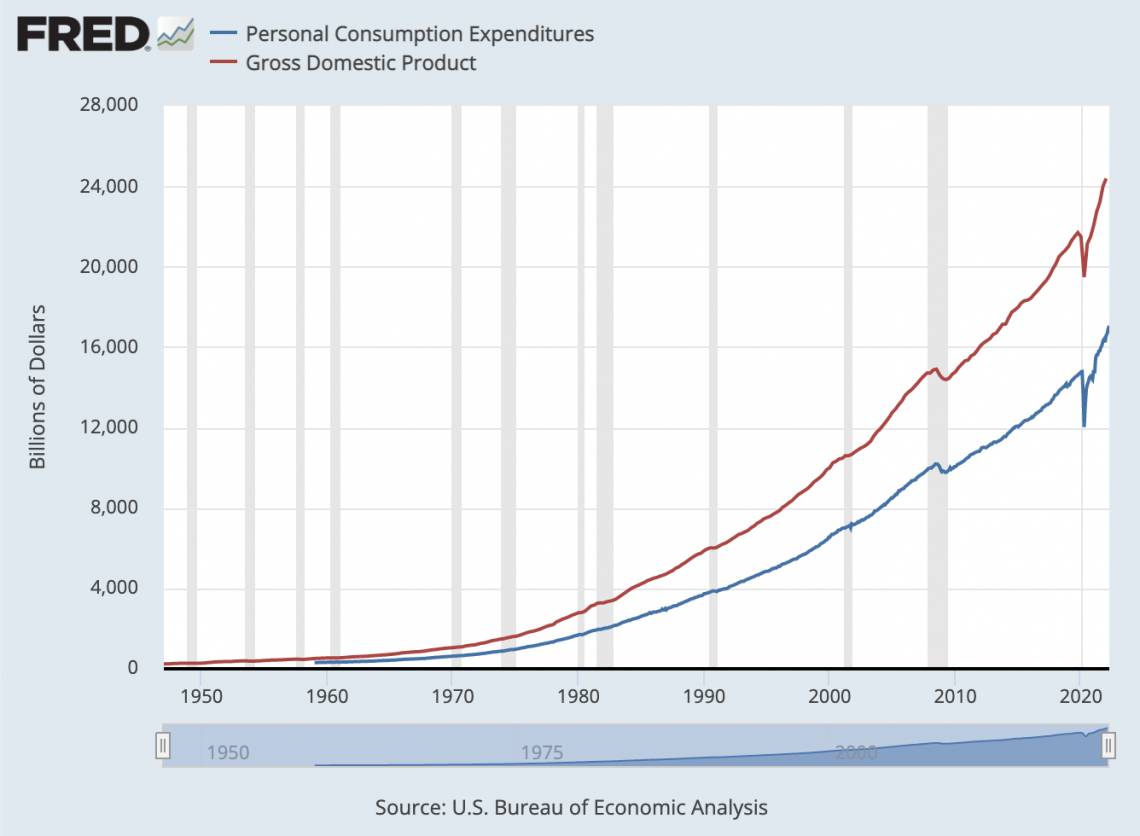
Approaching income from an expenditure perspective is pretty common, as it allows us to see which factors contribute the most to gross domestic product. In the United States, for example, consumption makes up a large percentage of GDP, as we can see from the graph.
Nominal GDP: The Income Approach
From an income perspective, the definition of nominal gross domestic product is the total dollar amount of income earned by individuals and businesses in the domestic economy.
There are a series of measures we can look at regarding income during the process of calculating GDP. These include:
1. National Income
National Income = Compensation for Employees + Other Income + Corporate Profits
2. Gross National Product (GNP)
Gross National Product = National Income + Depreciation
3. Gross Domestic Product (GDP)
Gross Domestic Product = Gross National Product + Net Factor Income
A simple way to think about these measures is by tracking how many of the main income categories they include. For example, national income includes only employee compensation, other income, and corporate profits.
Gross national product (GNP) includes all income categories in national income and factors in another category, depreciation.
Finally, the gross domestic product includes all GNP categories and adds net factor income. This means it takes into account all five main categories of income.
Net factor income reconciles the changes in income from people working abroad but sending money into the domestic economy and people working domestically sending money abroad.
GDP and Economic Policy
GDP is talked about so much in economics and finance because of its importance as an economic indicator. This is because the gross domestic product is a key measure of an economy’s health from a production standpoint.
From an economic perspective, changes in GDP are measured year over year to determine the economy’s strength. GDP growth and changes in inflation and unemployment form the basis for both fiscal and monetary policy.
GDP growth is calculated as a percent change, usually year over year. It can be calculated with the following formula:

GDP can also be calculated quarterly. Two consecutive quarters of negative GDP growth are considered to be a recession.
When GDP declines, there is usually a decrease in employment and inflation. Inversely, an increase in GDP growth is typically accompanied by rising employment and inflation.
Monitoring GDP in conjunction with inflation and unemployment is therefore important for policymakers. If GDP growth has risen above a level that is considered stable, inflation worries may cause policymakers to raise interest rates.
If GDP growth declines and policymakers fear rising unemployment, they may lower interest rates to stimulate the economy and help employment increase.
GDP and Financial Markets
Because GDP measures economic activity, it is clear why it also has important implications in finance. It follows that if the economic outlook is not positive, then the profitability of corporations would likely be lower as well.
We expect equity prices in financial markets to reflect these changes in GDP. Because of this relationship, it is no wonder that investors keep a close eye on gross domestic product.
However, for investors, it would be a mistake to say that GDP is actually what is affecting the day-to-day movements in the market.
This is because data on gross domestic product is released quarterly by the Bureau of Economic Analysis (in the U.S.) long after the quarter has ended.
The advance release comes four weeks after the end of the quarter, and the final confirmed number does not get confirmed until three months after the end of the quarter.
This means that for anyone making time-sensitive investment decisions, forecasting GDP and looking at other indicators will likely be more effective than waiting for the lagging data release on actual GDP numbers.
Another way GDP influences investor decision-making is through the total-market-capitalization-to-GDP ratio. If we were to compare different countries’ total market cap-to-GDP ratios, we would see that they are vastly different.
The main use of the ratio is to compare it to historical data. If the ratio is lower than it historically is, it would indicate that the total market capitalization of equities is undervalued. For some investors, this may lead to the decision to buy.
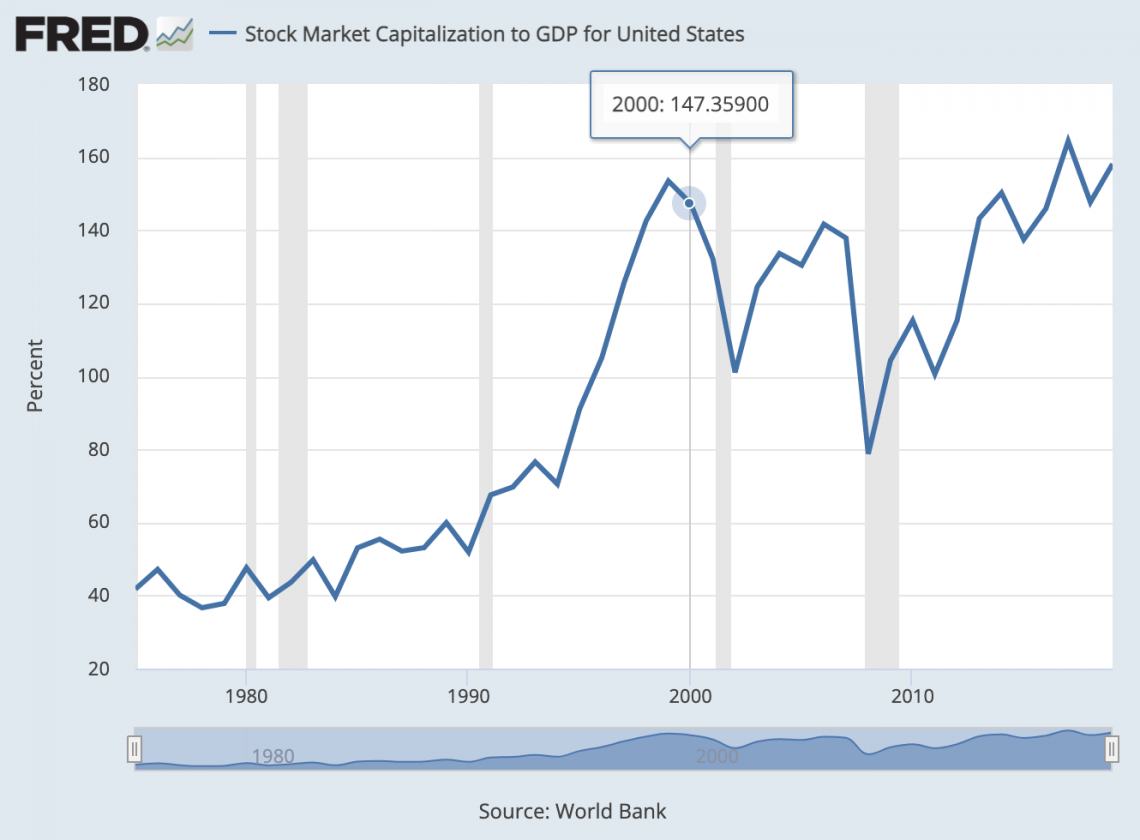
For example, this graph shows that the market cap to GDP ratio is quite high. Therefore, for some investors, worries about an overvalued market would begin to emerge.
Criticisms of Nominal Gross Domestic Product (GDP)
Although GDP is widely used and accepted as an economic indicator, there are still many criticisms of the measure.
One of the most common and major criticisms of GDP is that it fails to consider economic inequality and the workforce’s well-being.
A few big corporations in a country could significantly increase GDP even if the economy is desolate for the majority of the population.
GDP per capita is a standard metric used to measure economic output on a person-by-person basis. It is also often looked at as a measure of well-being. However, for the same reasons, this measurement is erroneous.
As we pointed out earlier, calculating GDP has specific definitions. As a result, certain economic activity is excluded. This inherently makes the accuracy of GDP measurement of economic output variable from country to country.
Depending on what proportion of economic activity is excluded from the calculation of GDP, its accuracy as a measurement can rapidly diminish.
Examples include under-the-table employment, activity in non-recorded markets, and unpaid volunteer work.
For some countries, specifically those with large amounts of transactions in underground markets, GDP calculations are far from representative of economic activity as a whole.
Furthermore, business-to-business transactions, which can fall under the category of intermediary goods and services, are also excluded.
This demonstrates a magnified focus on final consumption and fails to take into account the importance of this type of economic activity.
The impacts of this cannot be understated. First, if GDP is to be used as an indicator and a measure of the economy, excluding large portions of transactions, it desensitizes GDP to many fluctuations that may be occurring in the economy.
Graphs in this article can easily be replicated by taking Federal Reserve Economic Data (FRED) and using Excel. Learning to take data and create graphs is useful for most economic and financial professionals. Feel free to try our Excel course if you’re interested in learning.

Free Resources
To continue learning and advancing your career, check out these additional helpful WSO resources:


or Want to Sign up with your social account?