Production-Possibilities Frontier
A graph used to show the trade-offs between allocating resources toward one type of product rather than another.


What Is the Production Possibility Frontier (PPF)?
The Production Possibilities Frontier (PPF), also known as the Production Possibilities Curve (PPC), is a graph used to show the trade-offs between allocating resources toward one type of product rather than another.
On a macroeconomic level, a country needs to determine what type of goods they need more and produce those at a higher capacity. On a microeconomic level, a company should decide how to allocate resources to produce an optimal combination of its goods.
Command economies often struggle with allocating resources efficiently. This is because the government does not have businesses produce items per public wants and needs, but rather to what it has pre-decided. Therefore, it is hard for the government to change allocation after deciding on production.
- The Production Possibility Frontier (PPF) is a graphical representation of the maximum output combinations of two goods or services that an economy can produce, given its available resources and technology, assuming full and efficient use.
- The PPF reflects the fundamental economic problem of scarcity, where resources are limited, and choices must be made about what to produce.
- The PPF illustrates opportunity costs, as producing more of one good typically requires sacrificing the production of another good.
- The PPF is typically concave (bowed outward) due to the law of diminishing returns, which states that as more resources are allocated to one good, the opportunity cost of producing additional units of that good increases.
How Does the Production-Possibilities Frontier Work?
In market economies, the government does not dictate what businesses produce. So to make the most profit, companies need to decide how much of a product they need to manufacture on their own. Hence, companies change their resource allocation as consumer tastes change.
Command economies are known for being inefficient because there is no pressure to produce more of a good or to do so more efficiently.
Companies in market economies will produce items needed and wanted by the consumer while working to be the most efficient possible because of the competition in this type of economy.
Competition drives economies, so without it, we are left with largely inefficient economies. There are four assumptions made when looking at a production possibilities frontier, which are:
- The company/nation wants to produce two goods/types of goods.
- Resources are scarce.
- Technology and the factors of production are constant.
- Resources are used efficiently and to their maximum capacity.
Production efficiency is important but is just one of the types of efficiency needed. The other is allocative efficiency, when resources are allocated toward different types of goods to produce the most optimal combination of goods.
Both types of efficiency are necessary to have the most significant economic benefit. The public needs access to the correct amount of goods to fulfill their needs.
PPF and Constant Opportunity Costs
First, let us look at a production possibilities frontier with a constant slope. This means there is a consistent opportunity cost. An opportunity cost is the amount of one item forgone to get more of another.
There are a few key things to keep in mind when analyzing this type of graph:
- Points under the curve (light orange in the graph below) are inefficient but possible combinations of production.
- Points along the curve (bright orange line in the graph below) are the most efficient combinations of goods that a country can produce.
- Points outside the curve are unachievable unless there is economic growth or unless there is trade.
This is the production possibilities frontier for the kingdom of Fruitland.
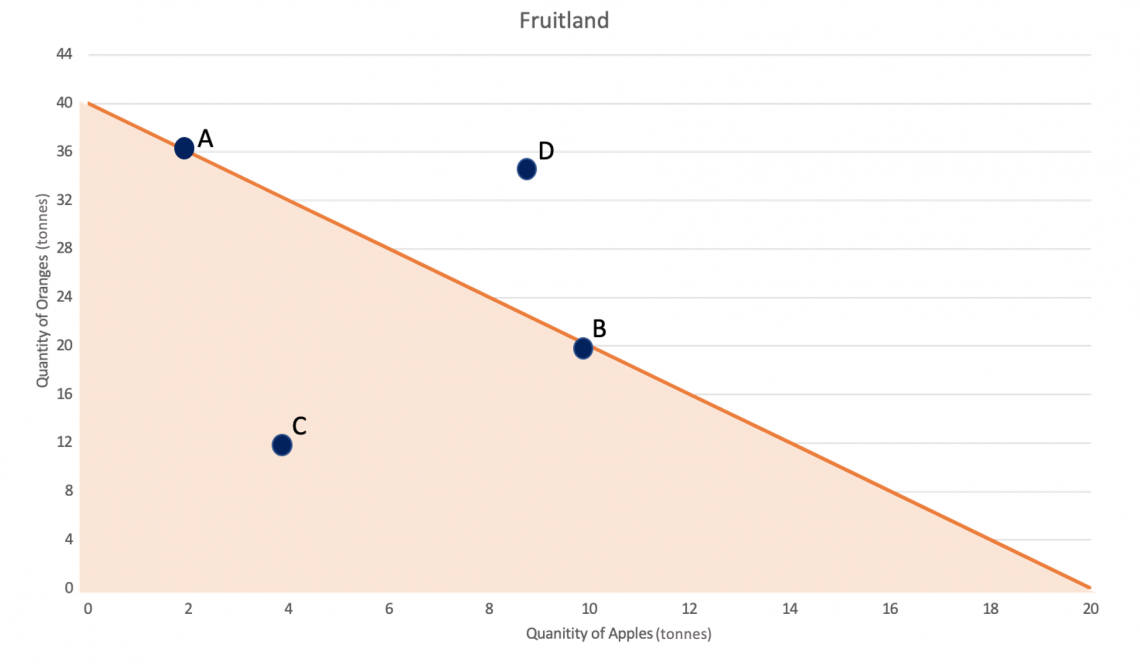
Let us calculate the opportunity cost of each extra ton of apples.
Looking at this graph, we can tell that the ratio between tonnes of oranges to tonnes of apples is 40 to 20, which simplifies to 2 tonnes of oranges to 1 ton of apples.
Thus, the opportunity cost of a ton of apples is 2 tonnes of oranges, and the opportunity cost of a ton of oranges is half a ton of apples.
Now, let us look at the labeled points on this graph.
- Points A and B are along the curve; they mark efficient and plausible quantities of apples and oranges that Fruitland can produce.
- Point C is inside the curve; this combination is possible but could be more efficient. Therefore, Fruitland can make more fruit than is indicated at this point.
- Point D is outside the curve; this amount of apples and oranges is attainable unless the nation decides to specialize and trade with another country or Fruitland experiences economic growth. Both of these options would cause the PPF to shift.
To have the best production efficiency, Fruitland should choose a combination of apples and oranges that falls along the graph's line.
To efficiently allocate, the nation must decide what type of fruit is more beneficial to themselves.
If oranges are constantly in very high demand and apples are not, farmers may decide to produce at a point close to A. If the opposite is true, they may choose to produce a combination at the other end of the line.
PPF and Economic Growth
As mentioned earlier, one way for a nation to produce outside of its production possibilities frontier is if the nation experiences economic growth.
Sources of economic growth can include increased factors of production, improved technology, and better resource allocation (if resources are not being used to their maximum potential).
The factors of production are:
- Land: physical space and the renewable and nonrenewable resources it provides.
- Ex. Lumber, water, oil, natural gas.
- Labor: the effort people put into doing their jobs.
- Ex. Cashiers who ring up items, architects who draw plans for buildings, and IT workers who assist with computer issues.
- Capital: the tools needed to produce goods and services.
- Ex. This factor looks different for every job. For construction workers, capital can look like forklifts and power tools, whereas for a software engineer, it could be a laptop.
- Entrepreneurship ability: the human ability to be creative, use the other three factors to produce items efficiently and make a profit.
- Ex. An entrepreneur could hire workers, purchase lumber, and rent out the appropriate woodworking tools to have a wooden furniture business.
Revisiting the graph from the Fruitland example, say that the nation’s farms have gained an influx of workers from neighboring countries and that farmers have purchased new planters to reduce seeding time.
Both of these will help increase the total amount of apples and oranges that Fruitland can produce because they have increased the resources that are the factors of production. So, the PPF will shift outward, as can be seen below.
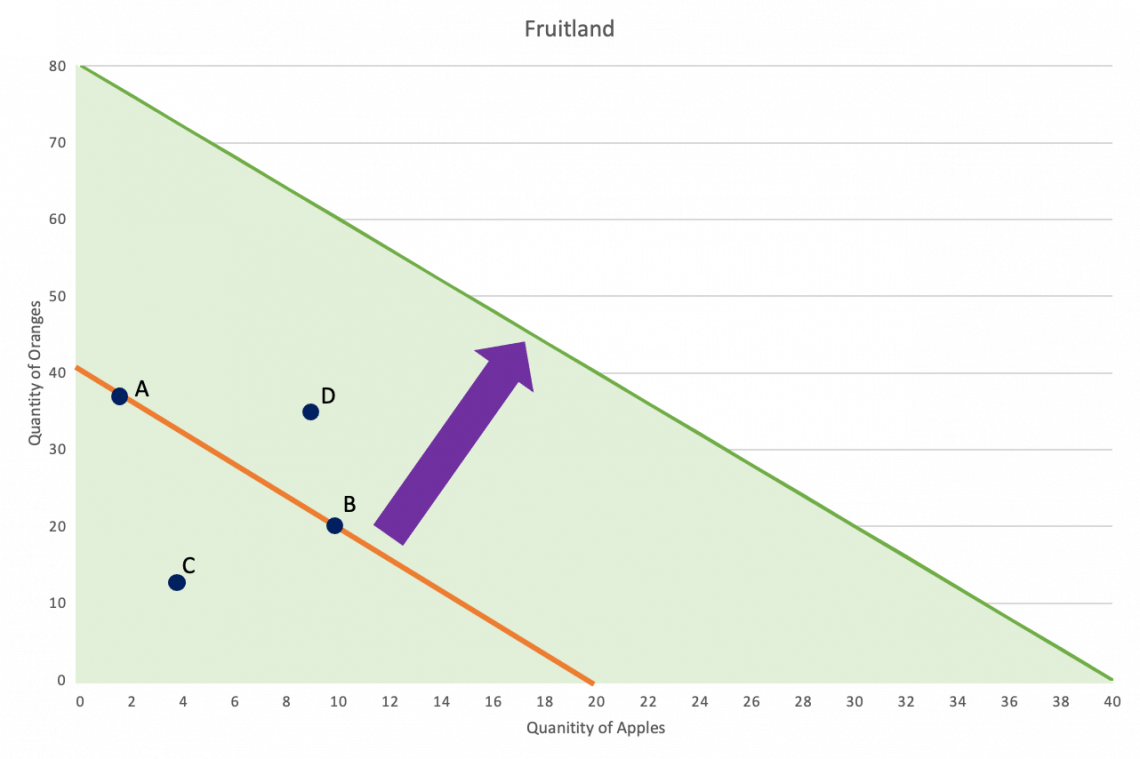
Due to the economic growth, Fruitland can now produce combinations of apples and oranges that previously was not possible, like point D. When employing all resources and technology, Fruitland can quickly produce 36 tonnes of oranges and 9 tonnes of apples.
The production possibilities frontier can shift inward if the economy shrinks, but this only happens sometimes.
PPF and Increasing Opportunity Cost
While the above situations have a constant opportunity cost, economists believe an increasing opportunity cost is more accurate. This means that instead of the graphs having straight lines, they would realistically be bowed out.
Let us use Pear Hardware as an example.
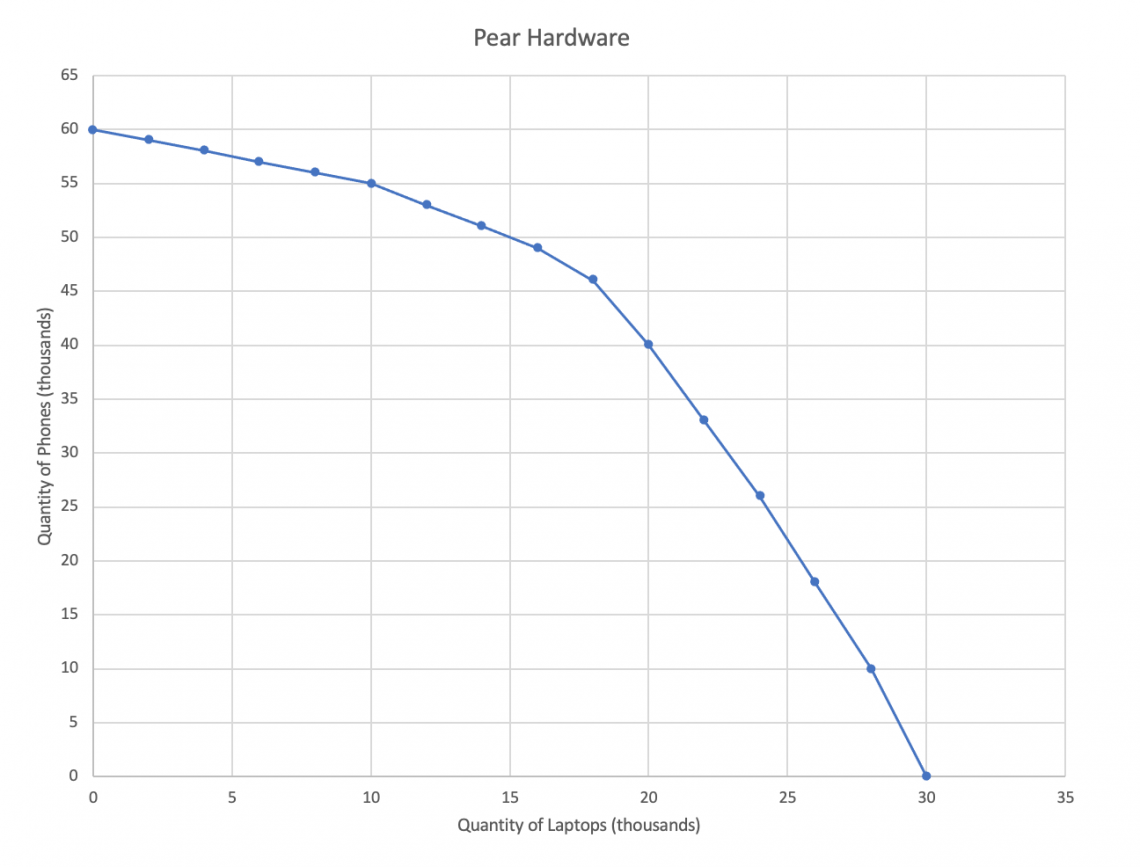
This PPF is more realistic because the opportunity cost between the two goods is not constant. However, opportunity costs can still be determined by looking at the slopes on the graph.
Towards the beginning of the graph, the opportunity cost of every thousand laptops was half a thousand phones. In the middle, each extra thousand laptops had the opportunity cost of one thousand phones; towards the end, the opportunity cost was four thousand.
Just as Fruitland had to decide what fruit their farmers should produce more of, Pear Hardware now needs to decide the combination of phones and laptops to produce.
Assuming there is no strong preference for either phones or laptops, the company needs to find a position where both products are produced at their maximum.
To help with this, we can look at a table of these values instead of the graph.
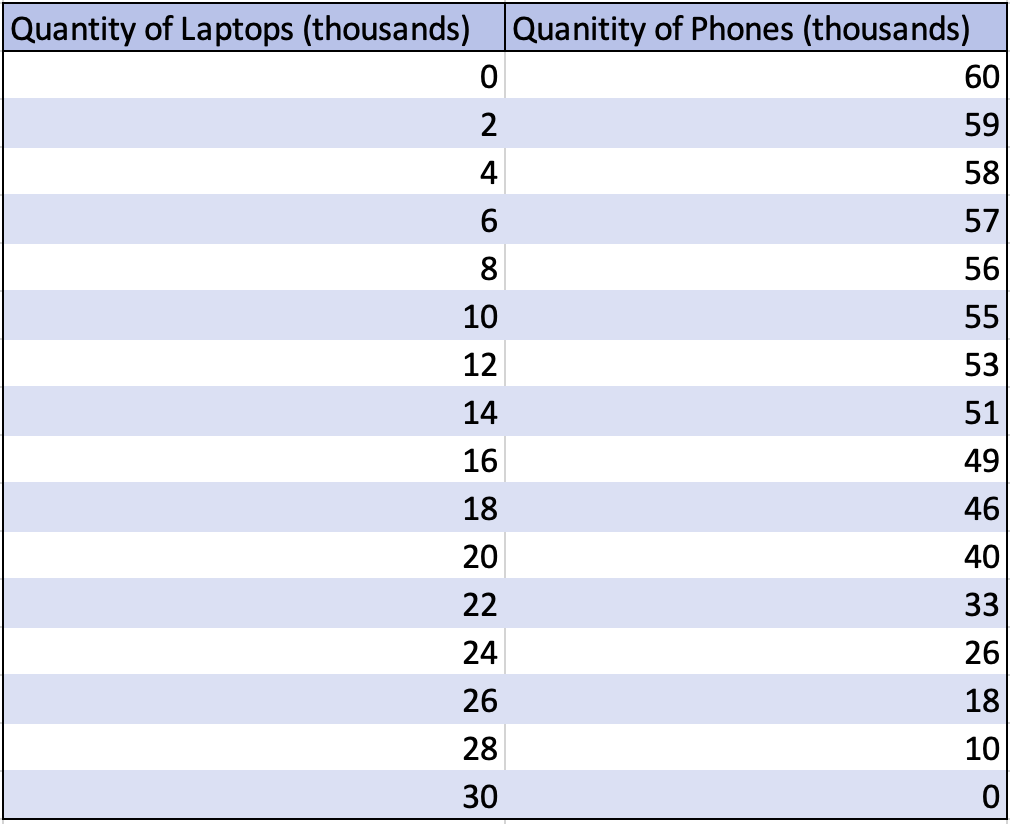
Using this chart, we can now find the point where the total amount of phones and laptops produced is the greatest.
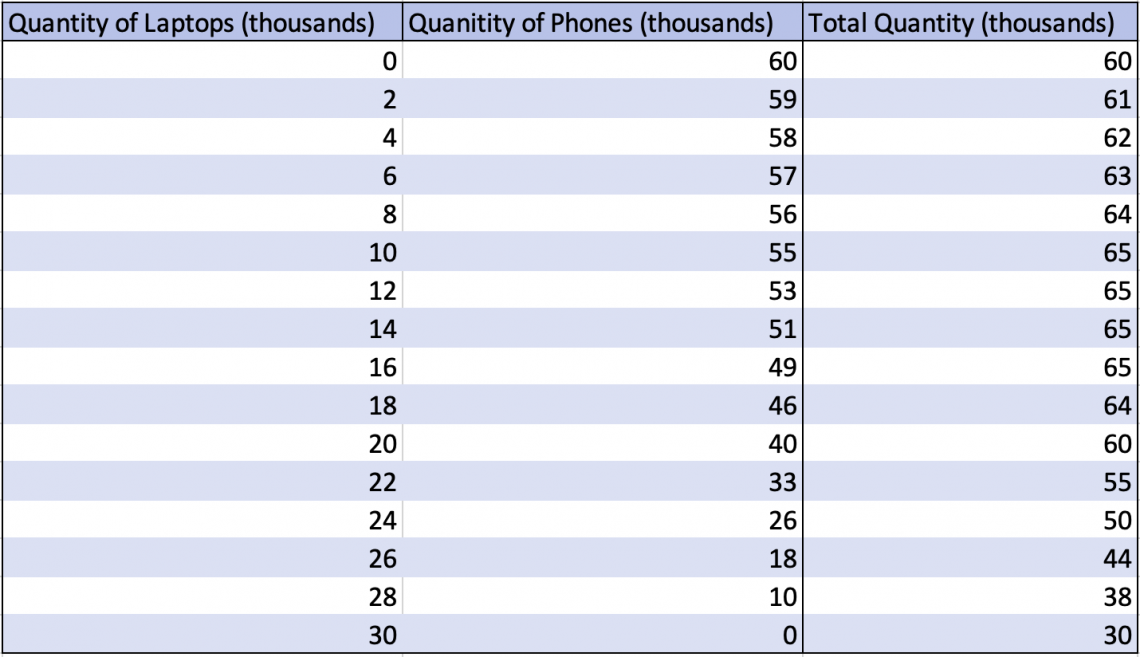
By doing this, we find that four combinations yield the maximum quantity of electronics: ranging from 10 thousand laptops and 55 thousand phones to 16 thousand laptops and 49 thousand phones.
From here, Pear Hardware can decide which combination they prefer and produce that amount. This way, they are both efficient in allocation and production.
However, if Pear Hardware has a customer base that demands more of one product than the other, it should also cater to those needs.
Comparing Two Nations’ PPF
One of the ways a country can have quantities of a product that lie above the PPF is for it to trade with another country.
We need to understand what type of advantage to look for; comparative advantage, not absolute advantage.
- Absolute advantage: A person or a country can produce a good at a higher actual quantity using the same amount of resources.
- Comparative advantage: A person or a country can more efficiently produce one type of good (proportionally); the nation has a lower opportunity cost to make more of a certain item than another.
Note
Just because a country has an absolute advantage does not mean trade will not benefit them.
Once the comparative advantages are calculated, the nations need to agree on terms of trade.
Let us reference Fruitland’s PPF again and also look at their neighbor Citrustan’s PPF.
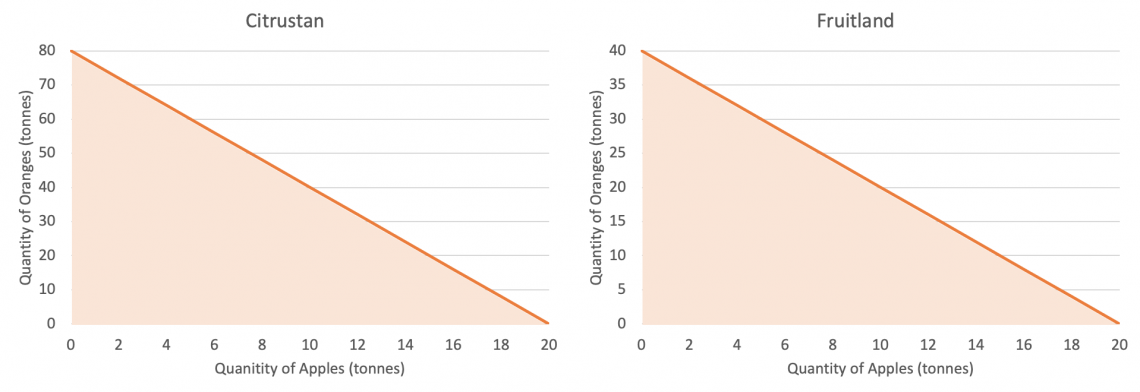
Using the information here, we can figure out the opportunity costs for each product for each country.
This means we need to find how many tonnes of oranges will be lost per country if each makes an extra ton of apples and how many tonnes of apples will be lost per country if each produces an extra ton of oranges.
Opportunity Cost = What you sacrifice / What you gain
| Citrustan Opportunity Cost | Fruitland Opportunity Cost | |
|---|---|---|
| One ton of apples | 4 tonnes of oranges | 2 tonnes of oranges |
| One ton of oranges | 1/4 ton of apples | 1/2 ton of apples |
Now that we have calculated the opportunity costs, we can compare them between the two nations.
Citrustan’s opportunity cost of an extra ton of apples is greater than Fruitland’s, so Fruitland has a comparative advantage and should produce apples.
Conversely, Citrustan’s opportunity cost of an extra ton of oranges is less than Fruitland’s, so Citrustan has a comparative advantage here and should produce oranges.
After determining what each nation should specialize in, they need to decide on terms of trade, which will indicate the rate at which the goods will be exchanged.
The terms of trade need to offer nations an incentive to trade. For trade to be mutually beneficial, a nation must offer a product at a lower opportunity cost than if their trade partner were to produce it themselves.
Citrus would gain a ton of apples for less than 4 tonnes of oranges, and Fruitland would benefit from a ton of oranges for less than half a ton of apples.
Thus, one of the appropriate terms of trade could be 3 tonnes of oranges for 1/3 tonnes of apples, as this combination falls between the bounds of less than 4 tonnes of oranges for less than half a ton of apples.

Free Resources
To continue learning and advancing your career, check out these additional helpful WSO resources:


or Want to Sign up with your social account?