U-Shaped Recovery
An economic recovery type occuring after a recession when the economy has experienced a sharp decline.


What Is a U-Shaped Recovery?
The U-Shaped Recovery is an economic recovery type that occurs after the recession when the economy has witnessed a sharp decline followed by a slow recovery over an extended period before returning to the prior peak.
The U-shaped recovery curve looks like a U. The U-shape of recovery happens due to recession, typically after a chronic one.
Any economy going down will be signaled by falling indicators. Once they reach their lowest points, these indicators might play around the bottom for longer.
That initially means that recession is persistent for a long time, and the economy is stagnant. This essentially means that before the economy starts to pace up, it might see clogged growth at different low points for an evident duration of time.
When the recession starts to phase off, it is not quick and follows a slow upheaval process. Gradual picking up of indicators shows better economic health. This phenomenon of phasing out is shown by the right vertical line of the letter U.
In contrast, the left vertical line indicates the slipping economy toward recession. The middle horizontal outer bulge is a prolonged duration of recession points for different indicators.
Simon Johnson, the former chief economist for the International Monetary Fund, has observed this topic. He stated that a U-shaped recession is like a bathtub.
"You go in. You stay in. The sides are slippery. You know, maybe there's some rough stuff in the bottom, but you don't come out of the bathtub for a long time.”
If we try to understand this statement, we can infer that by the phrase “sides are slippery,” he means that it will take a swift ride down for the economy.
But getting up from the other end is again too slippery and might need several tries. The bottom is not necessarily a stagnant point but can be multiple points up and down for a specific time frame.
But these bottom points lie in a certain range. The generic indicators of economic health used by economists to identify patterns and trends in growth are gross domestic product (GDP), employment, income, and industrial output.
- A U-shaped recovery is a gradual decline in economic activity, followed by a period of stagnation and then a slow return to pre-recession levels of economic performance.
- U-shaped recoveries can be caused by severe economic disruptions that require time to resolve, such as financial crises, structural changes in the economy, or significant policy adjustments.
- Key economic indicators to watch during a U-shaped recovery include GDP growth rates, unemployment rates, consumer spending, business investment, and industrial production.
- It may pose challenges for policymakers and businesses due to the prolonged period of low economic activity, leading to long-term unemployment, reduced confidence, and potential scarring effects on the economy.
Understanding the U-Shaped Recovery
After understanding the relevance and working of U shape recovery, we now need to know what we refer to as the “long time frame.” It is essential to know the time when the recession was chronically stagnant.
Generally, the U-shape recession or recovery takes a time of 12 to 24 months at the bottom horizon before the staggering economy again rises to pre-recession points.
It is not that post-recession, the economy suddenly looks excellent, and all indicators are flourishing.
Even after reaching the pre-recession points, how much sustainable recovery has occurred depends on factors like global economic stability, political stability, international relations, and, most notably, the reasons for recovery.
It might be that recovery happened due to some temporarily made reforms, or in the opposite case, healing is happening due to the constant reforming of economic structures.
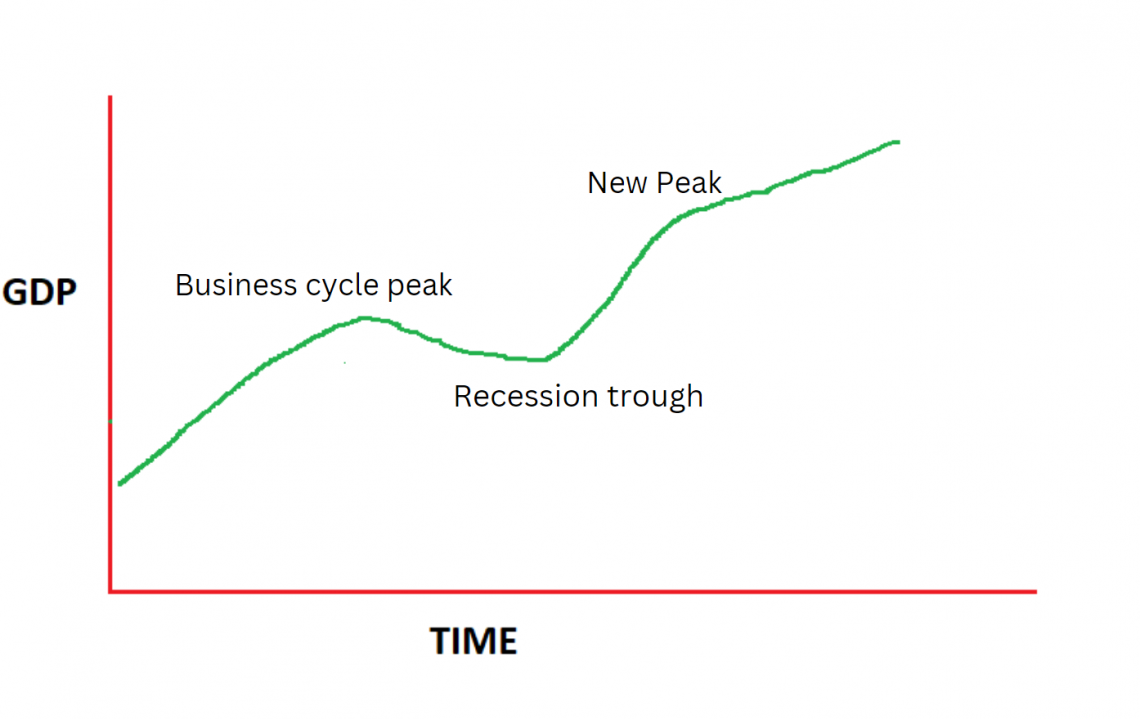
The image above shows a U-shaped recovery of GDP over time. It might be challenging to understand how the lower bulge signifies a U shape; therefore, let us break the image into small areas and then notice the pattern.
- The first point, or a slight peak, is when the business cycle shows the highest power.
If you are unaware of the concept, just know that business cycles refer to the economic path of countries.
Each business cycle occurs when the economy peaks and dips in a set time frame.
Back to the image, we see that as the business cycle reached the top, GDP started to fall steeper and in recession for a reasonable amount of time.
- These two constitute the left vertical and horizontal bottom bulge of the U shape.
- Once the economy starts getting out of recession, it can be seen clearly that it is a slow process to reach the last business cycle peak and then move towards a new peak.
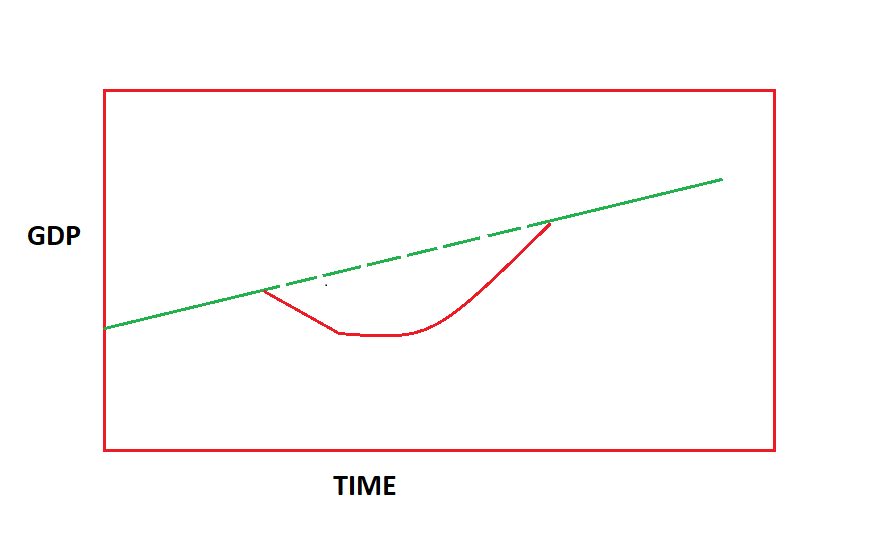
This second diagram is just a more precise version of the first. If you notice:
- The points are plotted to form straight lines to get a more visible range of the bottom bulge.
- With the help of this image, the U shape is persistently noticeable.
U-shape recovery has been a real-life phenomenon, and the world has experienced it quite a few times.
Economists believe that the recent global recession due to the COVID-19 pandemic led to a U-shaped recovery for economic health.
Discussing further, let us see how the U and V alphabets are slightly different and how these differences make a long and severe impact if seen on the economic front.
U vs. V-Shaped Recovery
A V-shaped recession or recovery is just a faster wave of recovery than then U-shaped one. In the V-shaped recovery, the steep downfall in indicators happens on the left vertical line, and the bottom here is a sharp, well-defined point or a concise time frame.
After a well-defined trough, the economy quickly moves out of the recession. In contrast, the U-shaped recovery has a non-clear trough of recession which persists for a longer time frame, and recovery is a slow process.
With this analysis, it is obvious that V shape recovery means less time of economic stagnation, which is a fairly ideal situation for economic growth.
The effects of U-shape recovery are long-term and highly severe, whereas V-shaped recovery rapidly grows the economy, and thus, recession takes less time to hurt the economy.
The diagram below shows the V curve recovery. Comparing it with the second diagram, we can observe that here the lowest point is visible at the bottom, whereas, in U shape recovery, the lowest point is a range of some surrounding bottom levels.
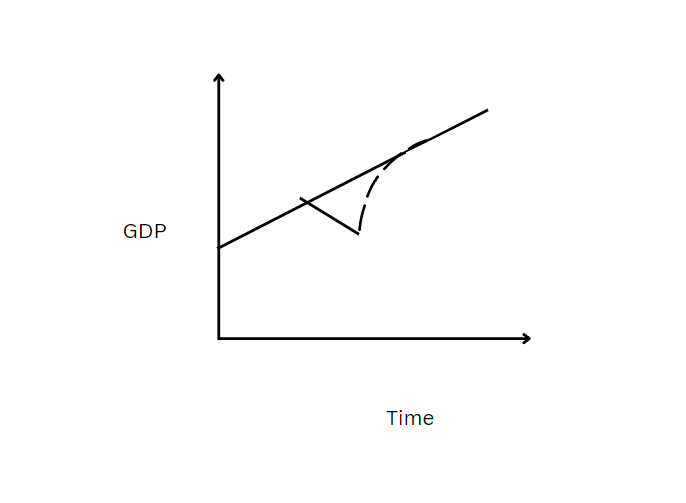
In the V shape diagram, it is observable that bounce back from the bottom happens in a very short span of time and steeply.
U-Shaped Recovery: The Recession of 1973 to 1975
It is not baseless to argue that the U shape of recovery is what the world is familiar with. The connection between the U.S with U shape recovery or U-shaped recession can be traced long back.
The U.S has experienced economic depressions where cycles of recessions took place. Two of those cycles followed a U shape of the recovery.
Discussing them further, we will observe how U shape cannot be the ideal recovery path.
- The recession of 1973 to 1975 was one of the clearest U-shaped recessions in the history of the U.S., accompanied by stagflation.
- The economy started diving slowly in early 1973 and continued to hover around the bottom for the next two years.
- However, in mid-1975, the pace started picking up again, but the process of progress was gradual.
- The lowest point of this recession period was when GDP dipped by 3%. The reason behind such a recession was based on foundational inflation problems.
- This U-shaped recession resulted from the oil price shock in 1973 when oil became drastically expensive.
- The cherry on the cake was the world's worst stock market crash from 1973 to 1974, which eroded an incredible amount of wealth from the market.
This stock market crash adversely affected almost all the trading markets in the world.
- Inflationary after-effects of the Vietnam War financing and significant social welfare state expansion under the presidency of Johnson.
- After him, President Nixon used Keynesian deficit spending policies.
As discussed earlier, the U-shaped recovery is not a recovery without pain and brings persistent problems as after-effects. In such a case, the U.S. economy marked the growth path in 1975, but this was accompanied by widespread unemployment and tremendous inflation.
The decade of the 1970s thus is known as the stagflation period. The percentage of real GDP changed in the U.S. economy during the quarterly analysis of the recession period from 1973 to 1975.
Further, the real GDP followed a very steep downfall since the first quarter of 1973, marking the recession's initial point.
For the next seven quarters after that change in GDP, it continuously hovered around the range of negative 4.5% to positive 4 %.
This stagnation of recession is the bottom bulge of U-shaped recovery. After this, from early 1975, we can view the trekking up of the GDP to reach new highs but in a very gradual manner. Thus, it represents the U shape of the recovery.
The Prolonged Recession: 1990 - 1991
The recession was prolonged due to past actions from 1990 to 1991. This recession period in the U.S. economy is associated with the term “jobless recovery.”
The story started off in the early 1980s when banks, savings, and loans were de-regularised in the economy.
This led to commercial and real estate lending being fast-moving in the country. With a very accommodating stance, the Fed loosened the monetary grip, and interest rates fell as the economy emerged from the recession of 1982.
This boom of easy loans got people's hands off risky mortgages and created a massive debt bubble creation.
In the late 1980s, this debt bubble burst and provided massive debt deflation, extensive losses, and failure of the banking system across the market.
The financial and real estate market crashed, which ignited the fire of recession in the early 1990s. Massive unemployment continued until 1992.
Total employment reached a pre-recession level in 1993. Because of these circumstances, the U-shaped recovery has shown clear signs of jobless growth.
The turning point came in the mid and late 1990s when unemployment fell and GDP levels rose.
Overall, the recovery was classified as a U-shaped recovery by Keynesian and neoclassical economists.
Similarly, the deficit in the Fed for four decades tells the low counterparts of the obligation.
This means that the economy lowered its deficits due to increased banking deregulation.
But when we consider the periods after the dip, the debt has been increasing since then at a high pace and steeper notes.
Until now, we have seen how economies drown in recession before taking significant time to recover.
The time they take to recover thus specifies the shape of the recovery path they follow. Not only that, but the speed of recovery also depends on fiscal and monetary actions.
For example, if the imbalance were caused by inflationary pressures that took a reflection of extensive monetary expansion, it would be ideal for tightening monetary and fiscal policies to have a speedy recovery.
When governments choose paths that follow slow cause-and-effect relations, they foster U-shaped recovery.
Therefore, it is essential to use the right policies at the right time but with knowledge of when economic goals should be achieved.
Economists should prefer policies that govern V-shaped recovery and minimize the bottom stagnation of U-shaped recovery.

Free Resources
To continue learning and advancing your career, check out these additional helpful WSO resources:


or Want to Sign up with your social account?