Asset Turnover Ratio
A financial ratio that measures the company’s ability to earn revenues with its assets in a given period.


What is the Asset Turnover Ratio?
The Asset Turnover Ratio or sometimes the Total Asset Turnover Ratio, generally measures the company’s ability to earn revenues with its assets in a given period.
For instance - A ratio of 1.3 indicates the company can earn $1.3 of revenue for every dollar of average assets.
A higher number means greater efficiency in generating revenue. This ratio includes the average of both fixed and current assets.
A low ratio may indicate lower efficiency; these are usually companies in a capital-intensive sector or industry or a new business that is just starting up and is not yet operating at full capacity.
In addition, asset turnover can be affected by factors other than a company's efficiency.
For example, the ratio would be lower for a company with newer assets that are not yet depreciated and have a higher carrying value in the Balance sheet compared to that of a company with older assets that are highly depreciated.
Analysts use activity ratios to measure the company's efficacy in using assets to generate revenue. Other than that, ATR can calculate ROE(Return On Equity) in Dupont analysis.
Investors and analysts can use this measure to compare similar companies to know how efficiently they use their assets.
However, It is helpful to analyze the Working Capital Turnover Ratio and Fixed Asset Turnover Ratio separately to understand revenue-generating assets better. A general rule of thumb is that a higher ratio means more efficient use of the company's assets.
- The asset turnover ratio is a financial metric that measures the efficiency of a company's use of its assets to generate sales revenue. It indicates how effectively a company is utilizing its assets to produce revenue.
- A higher asset turnover ratio indicates that a company is efficiently using its assets to generate sales. Conversely, a lower ratio suggests that the company may not be utilizing its assets effectively.
- Effective asset management practices, such as optimizing inventory levels, improving receivables collection, and strategic asset investments, can positively influence the asset turnover ratio.
- The asset turnover ratio provides insights into asset efficiency but does not account for profitability or the quality of sales. High sales with low profit margins can result in a high asset turnover ratio but may not be sustainable in the long run.
Formula for Asset Turnover Ratio
The formula for calculating ATR is:
Asset Turnover Ratio = Net Sales / Average Assets.
Where
- Net sales: Revenue is reported after adjustments for discounts, returned goods, or other reductions. The term net revenue is sometimes used in the Income statement to indicate that the revenue has been adjusted with the mentioned deductions.
- Average assets: The average assets can be calculated by taking the beginning total assets(total assets of the previous year) and total assets of the current period from the Balance Sheet and averaging them out.
Average Assets = (Beginning asset + Ending asset) / 2
Asset turnover ratio example
Let us understand this with a simple example:
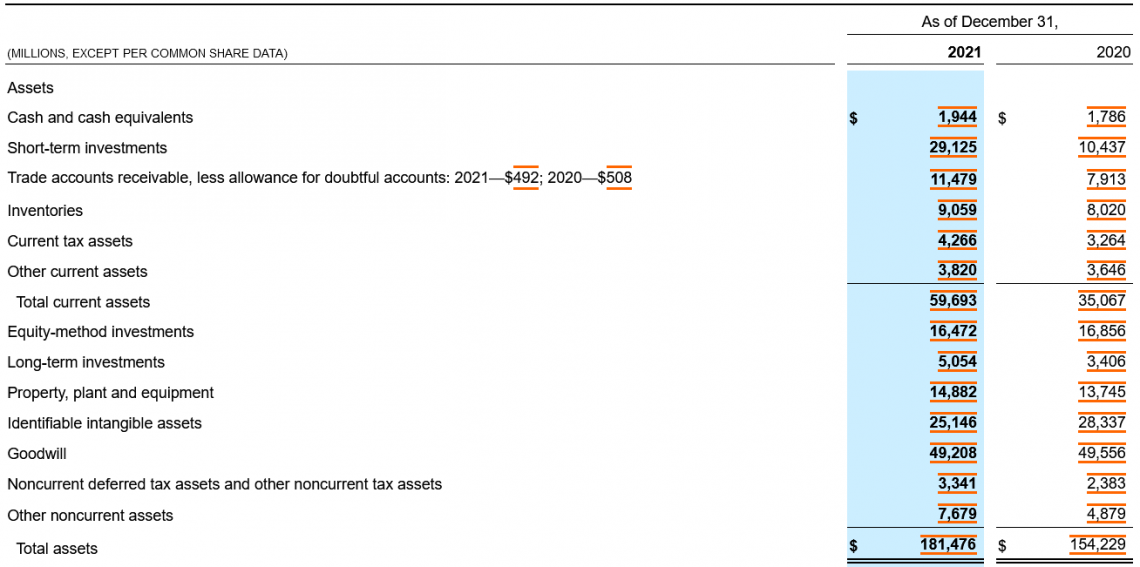
The following is Pfizer's Balance Sheet and Income Statement according to their Form 10-K, which they submitted to the SEC:
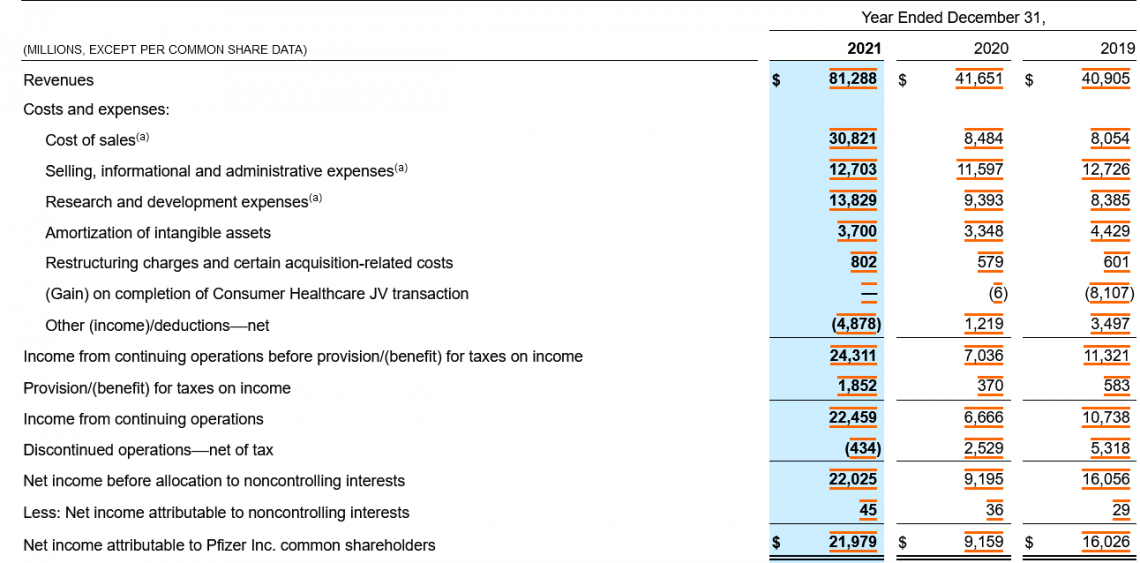
Income Statement
Based on these figures
- Total Assets 2020 = $154,229
- Total Assets 2021 = $181,476
Average Asset = ($154,229 + $181,476) / 2 = $167,852.5
Total Asset Turnover Ratio = $81,288 / $167,852.5 = 0.48
This means in 2021, with every dollar worth of assets, Pfizer could generate $0.48 in revenue.
Novartis, one of the major competitors of Pfizer, had an Asset Turnover Ratio of 0.4.
Major pharmaceutical companies had an average of 0.45 in the year 2021. Comparing these numbers, we find that Pfizer was more efficient in using its assets than most other pharmaceutical companies.

Interpretation of the Asset Turnover Ratio
A higher ratio indicates better efficiency in managing assets to generate revenue. It should be considered that this ratio alone is not an indication of asset management efficiency.
The analysis should also include other relevant ratios, such as Working Capital Turnover Ratio and Fixed Asset Turnover Ratio. These are called activity ratios or efficiency ratios. Inventory turnover or account receivable turnover are other examples of activity ratios.
ATR analysis should consider the sector or group the company is operating in. Different sectors have different asset structures. For example, utility companies have a more extensive asset base than software companies.
Management decisions to use a labor-intensive rather than a capital-intensive approach can affect this ratio. Companies that operate in a capital-intensive environment have a more extensive asset base than companies that use labor instead of machinery.
Purchasing significant assets(e.g., PPE and goodwill) or liquidating an important asset can distort the ratio. It is more helpful to analyze the ATR in consecutive years to find the general pattern of asset turnover.
The depreciation method can affect the value of the reported assets, which can affect the ratio.
Companies with newer assets that haven't fully depreciated have a lower ratio than a similar company with older assets.
Using the Asset Turnover Ratio With DuPont Analysis
Dupont analysis is a technique to decompose the ROE into its essential components. Each part is an indicator of some aspect of a company's performance.
Breaking the ROE down allows investors to understand better the items affecting a company's profitability over time or the profitability of different companies in a given period.
One of the significant applications of the Asset Turnover Ratio is the Dupont analysis. This formula uses ATR to calculate the ROA (Return On Assets). ATR is one of the items that significantly affects ROE (Return On Equity).
We can break down the ROE in several ways to see which component has the most significant effect.
ROE = ROA x Financial Leverage
ROE = Net Profit Margin x Total Asset Turnover x Financial Leverage =
(Net Income / Sales) x (Sales / Total Assets) x (Total Assets / Total Equity)
Or, in a 5-step DuPont analysis:
ROE = Tax Burden x Interest Burden x Operating Margin x Total Asset Turnover x Financial Leverage
(Net Income / PreTax Income) x (PreTax Income / Operating Profit) x (Operating Profit / Revenue) x (Sales / Total Assets) x (Total Assets / Total Equity)
Dupont analysis assists in finding the weak spot of Return on Equity. Based on the 5-step Dupont formula, low ROE may result from high tax or high interest expenses.
Companies may operate in a low operating profit industry, or they use their assets inefficiently, or maybe inefficient use of debt to finance their assets is the culprit...
More efficient companies tend to have an increasing ROE. Because, in time, they manage to decrease their expenses relative to their revenue, resulting in a higher net profit margin.
Companies with better asset management tend to have a higher asset turnover.
Asset Turnover Ratio Points to Remember
A few points to remember are:
- All assets are included in calculating the ratio, which does not directly participate in revenue, e.g., Cash and Goodwill. After acquiring other companies, the ratio might suddenly drop because of the goodwill.
- Selling or leasing the assets increases the ratio and can signal higher efficiency but may not result in higher profitability.
- As with any other financial ratio, ATR cannot be used individually to assess the efficiency of utilizing assets. This ratio only shows the correlation between total assets and revenue. It shouldn’t be interpreted as causation. Therefore, ATR must be combined with other ratios to understand a company’s fundamentals. A higher ratio does not translate to higher profit. For example, the retail sector has the highest turnover ratio compared to other sectors, but, being a very competitive market, it tends to have a lower profit margin.
- The company’s decision to choose the Depreciation method can distort the ratio result. Two companies with the same asset and sales show different ATR depending on their preferred method for depreciating their assets.
- ATR analysis will differ between sectors and competitors in the same industry. Depending on the product specialists and business models, companies within an industry might report very different turnovers. For example, read this on Tesla Vs. GM In Asset Turnover Ratio.
What is a good asset turnover ratio?
Generally, the higher the ratio, the higher the company's efficiency in generating revenue relative to its total assets. For example, a ratio of 1.5 means the company can generate 1.5 dollars worth of revenue for every dollar invested in assets.
A good ratio has a different meaning in different industries. For example, in industries like grocery stores and retailers, whose primary asset is inventory, they need to sell their stock as fast as possible to maintain a profit. As a result, they have a higher ATR.
According to a recent survey (Q4 2021), the Retail sector has the highest ratio (3.0), followed by Capital Goods and Basic Materials with 1.52 and 1.23, respectively.
It is worth mentioning that these benchmarks are the average of the whole sector, and based on the business model of the firm and management’s decisions, these numbers may vary between companies. For example, Walmart Inc had a ratio of 2.3, and Amazon reported a turnover of 1.3 in 2021.
The high ATR value of companies like Walmart is attributed to their assets. Supermarkets and grocery stores generally have low profit margins and high asset turnover.
Supermarkets typically lease their buildings, and their fixed assets mainly consist of shelves and refrigerators to showcase their goods.
However, in industries with a high asset base, as in the automobile industry, companies have to maintain a high-cost asset base to stay in the market, leading to a lower asset turnover.
In comparison, Tesla Inc reported an asset turnover of 0.94 in 2021, General Motors reported 0.47, and Honda Motor Co., Ltd reported a turnover of 0.7 in the same period. It shows Tesla could generate $0.94 worth of revenue for every dollar of its asset base.
It is worth mentioning that although a very high asset turnover may indicate an efficient use of assets or a high inventory turnover, this may not always result in a more efficient company.
Some companies employ high-efficiency inventory management systems( e.g., Lean manufacturing ) to reduce production lines and their supply chain response time.
This approach requires estimating the required inventory as accurately as possible and having reliable suppliers in the supply chain. A minor delay in the production chain or issues on the supplier side can negatively affect the system and the company's profitability.
How Can a Company Improve Its Asset Turnover Ratio?
The ratio measures the company’s efficiency in managing its assets to generate revenue. A higher turnover ratio signals creditors and investors that the management is using the company’s resources efficiently.
On the other hand, a low ratio will signal excess production, substandard inventory management, and poor customer debt collection agreements.
Asset turnover is calculated by dividing revenue by the average asset. Simply speaking, it’s a fraction. Any changes that increase the revenue (numerator)or decrease the assets(denominator) can improve the ratio. For instance, increasing the revenue can be done by:
- Promotion and advertisement by offering coupons, free products, or bundling.
- Accelerated shipping of goods to improve revenue recognition.
- Enhance the contract with the customers to increase Account Receivable Turnover.
Or by decreasing the average assets in the denominator through:
- Employ a better inventory management system to reduce the inventory size on hand.
- Liquidating unused or low-performance assets.
- Maintaining profit-generating assets regularly to increase efficiency.
- Leasing the assets instead of buying them.
- Using accelerated depreciation methods.
Although the solutions mentioned above can improve asset turnover, these actions can also be used to manipulate it. Therefore, investors should analyze the reasons behind a company’s ATR changes.

Researched and authored by EBi Dadgar
Free Resources
To continue learning and advancing your career, check out these additional helpful WSO resources:


or Want to Sign up with your social account?