CAPEX to Operating Cash Ratio
Financial metric used to assess a company's ability to generate cash


What Is The CAPEX To Operating Cash Ratio?
The Capex to operating cash ratio shows how much of the company's cash flow is put into Capex. Capex is an expense made by the company to acquire, maintain, and update the physical assets of the company.
In some cases, expenses like R&D are also capitalized if it is relevant to the company. For example, pharma companies usually capitalize on their R&D expenses.
The Capex to operating cash ratio is a financial risk ratio. Financial risk ratios assess the risk of default. This particular ratio measures how much the business is focusing on capital-intensive projects.
Capital-intensive projects usually come with financial risks as they need a large amount of money; even if it is financed entirely by equity, it has specific financial trouble. Therefore, more often than not, significant Capex is funded by some combination of debt and equity.
As the ratio is focused on if the company is participating in Capex, it is mainly used for more growth-focused companies as they are the ones in need of constant Capex.
Depending on the firm, other expenses like R&D and intangible assets like trademarks, patents, and copyrights can also be capitalized to get a better picture of the business.
Capex to Operating Cash = Cash Flow from Operations / CAPEX
Cash Flow from Operation is provided in the cash flow statements section of the annual report.
Capex = Net change in property, plant, and equipment (PPE)
The net change in PPE is calculated by subtracting the current year's PPE from the previous years and subtracting the current year's depreciation expense.
Additions like intangibles can be made to the Capex depending on the type of company. For example, for Disney, we can consider the intangibles and goodwill as Capex as it is a major cash-generating asset for the company.
-
The CAPEX to Operating Cash Ratio measures how much of a company's operating cash flow is directed towards capital expenditures (CAPEX). It gauges the company's risk and its focus on growth through capital-intensive projects.
-
Calculate the ratio by dividing Cash Flow from Operations (CFO) by CAPEX. CFO reflects core cash generation, while CAPEX is the net change in assets like property and equipment due to acquisitions and disposals.
-
The ratio helps assess a company's capital spending strategy and growth prospects. A higher ratio often suggests a stronger emphasis on reinvestment for expansion, but its meaning varies based on industry, company stage, and overall strategy.
-
The ratio is most valuable when comparing companies within the same industry or to industry averages. A below-average ratio might indicate underinvestment, an average ratio shows typical reinvestment, and an above-average ratio suggests higher capital spending for growth potential.
Understanding the CAPEX to Operating Cash Ratio
The financial risk ratio helps us assess the company's risk profile based on how much cash from the operating cash flows is being diverted towards capital expenditures.
This ratio is better suited for growing businesses with higher capital spending.
Usually, a higher ratio is considered better, but the interpretation of this ratio depends upon the type of business, past data, company vision, and overall ability of the analyst.
The ratio is best used on a relative basis to compare a business to its peers or the industry average.
There are three outcomes to the Capex to operating cash ratio, which can be interpreted differently depending on a few variables:
1) The ratio is below the industry average
If the ratio is below the industry average, the company is spending less on capital expenditure compared to other peer companies.
This is a wrong signal as if the company is not investing in Capex, it will not be able to grow at the industry level and will lose its market share to its competitors.
This could also be interpreted in another way that the company is generating such excess operating cash flows that it can fulfill its Capex requirements at a fraction of what other players in the industry need.
It can also mean that other firms are fueling their Capex with debt rather than just the CFO. So this isn't necessarily bad; several other factors must be considered before arriving at a verdict.
2) The balance is an industry average
There is little to interpret here if the ratio is at the industry average. However, it means the company is not lacking behind its competition in terms of reinvesting back into the business.
This can be used as a double-check for valuing the company. For example, if the ratio is at the industry average, but the company is trading at a cheaper valuation than its peers, it can be said that it is undervalued.
Similarly, the company can be overvalued if its peers' valuations are more expensive.
3) The balance is above the industry average
If the ratio is above the industry average, the company spends more on Capex than its peers. More capital spending means there will be higher growth in the business.
This should usually mean that the business will command a higher valuation, but some other factors must be considered.
Maybe the business is using debt to fund its Capex, which means the overall risk of the operation also increases.
It could also mean that the CFO generated by this business is lower than the industry average, so they need to spend more of it to fulfill their capital requirements.
These and a few other variables must be considered before arriving at a decision.
Looking at the above three points, it would be safe to assume that the ratio is not as good on a standalone level and needs to be looked at with other variables to conclude.
How Can We Calculate CAPEX to Operating Cash Ratio?
The ratio is a measure of financial risk; it calculates risk by comparing how much Capex is being done to the CFO.
To better understand the ratio, we will use it as a relative value metric to arrive at a valuation verdict for the securities. This ratio is best used for companies operating in similar business environments and at similar phases of their corporate life cycles.
Exhibit 1:
Advanced Micro Devices Inc. (AMD) vs. NVIDIA Corporation (NVDA)
AMD and Nvidia are the world's most influential technology and semiconductor chipset manufacturing players. In addition, both are relatively mature companies with high industry tailwinds and demand growth.
Nvidia Corporation (10-K)
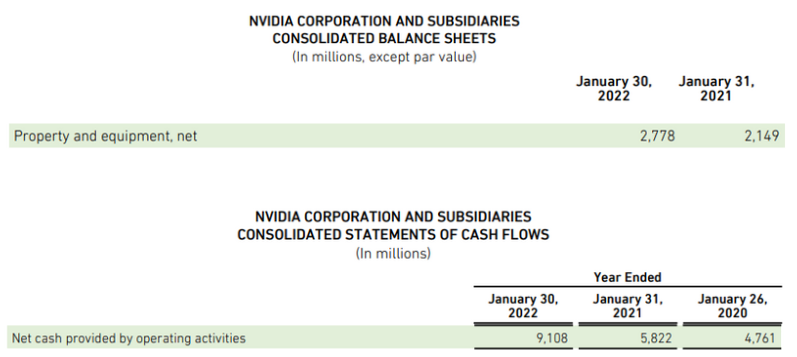
► The Capex to operating cash ratio for NVIDIA Crop. for 2022 will be:
Capex = Net Property Plant and Equipment
= 2778 - 2149
= 629
CFO = 9108
Capex / CFO = 629 / 9108
= 7%
I.e., NVIDIA uses 7% of its cash flow from operations towards Capex.
Advanced Micro Devices (10-K)
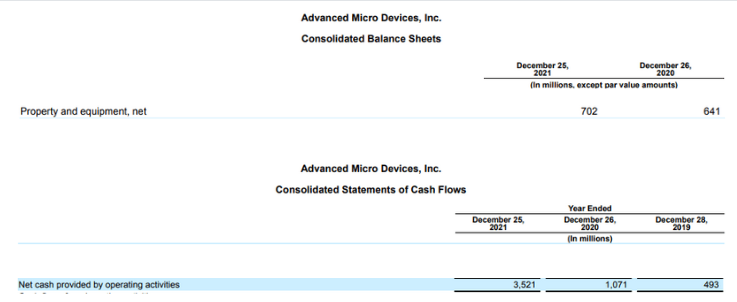
► The Capex to operating cash ratio for AMD is:
Capex = Net Property Plant and Equipment
= 702 - 641
= 61
CFO = 3521
Capex / CFO = 61 / 3521
= 2%
I.e., AMD uses 2% of its cash from operations for Capex.
When we compare the two businesses, NVIDIA uses 7% of its CFO as Capex, while AMD only uses 2% of its CFO. This means that NVIDIA has better chances of growth as it has higher capital spending.
A higher capital spending is looked upon favorably, especially for these businesses, which are in a highly competitive space and have top-line solid demand and growth.
A higher ratio usually means NVIDIA will command a higher valuation than AMD. For example, NVDA has a TTM P/E of 50 while AMD has a TTM P/E of 38.
Both companies are spending less than 10% of their CFO for Capex; being technology businesses, they naturally have lower capital spending. They are also pretty mature, so the incremental need for spending capital is also common.
Exhibit 2:
Walmart Inc. (WMT) vs. Costco Wholesale Corporation (COST)
Walmart and Costco are both US retail giants; although their business model is slightly different, they still operate in the same industry and can be compared with the ratio.
Walmart Inc. (10-K)
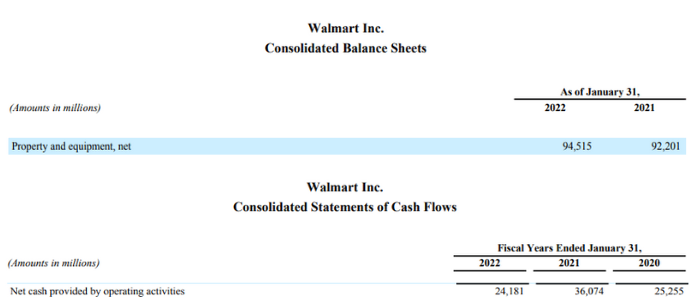
The Capex to Operating Cash ratio for Walmart is:
Capex = Net Property Plant and Equipment
= (94515 - 92201)
= 2314
CFO = 24181
Capex/CFO = 2314 / 24181
Capex/CFO = 9.5%
I.e. Walmart uses 9.5% of its CFO for capital expenditures.
Costco Wholesale Corporation (10-K)
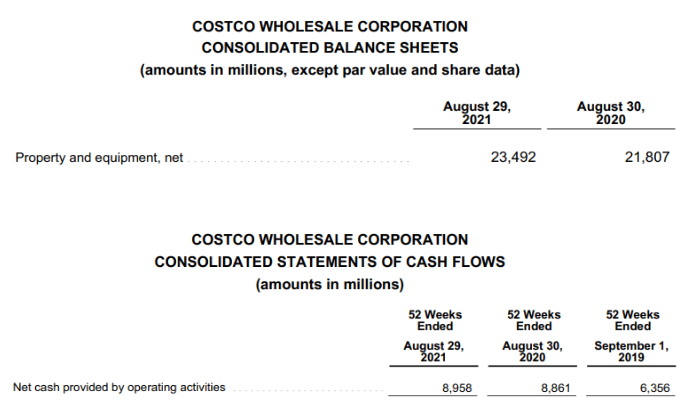
The Capex to Operating Cash ratio for Costco is:
Capex = Net Property Plant and Equipment
= (23492 - 21807)
= 1685
CFO = 8958
Capex / CFO = 1685 / 8958
= 19%
I.e., Costco uses 19% of its CFO as Capex.
Walmart uses only 9.5% of its CFO, while Costco uses 19% of its CFO as Capex. This means that Costco is currently fueling more growth than Walmart.
This is also clearly represented in their valuations WMT is trading at a TTM P/E of 27, while COST is selling at a TTM P/E of 37 on account of its higher growth.
Capex to Operating Cash Ratio vs. Operating Cash Flow Ratio
Both ratios, as mentioned earlier, are used to measure a particular business's financial risk.
The operating cash flow ratio measures how well the company manages its current liabilities by measuring how much of its current liabilities it can pay off from its CFO.
This measure ensures that the company is making efficient use of its working capital and short-term obligations and not taking excess short-term commitments.
The formula is very straightforward:
Operating Cash Flow Ratio = CFO / Current Liabilities
This ratio is used like a multiple; it is preferred that the balance be over 1. But that varies from business to business and company to company.
Some businesses, like manufacturing and retail, have very high inventories and cash balances, making it impossible to have a ratio close to 1.
The ratio is best used as a relative metric rather than an absolute one.
The primary way it differs from the Capex to operating cash ratio is that the OCF ratio uses the cash flow from operations as a coverage metric. In contrast, the other balance uses CFO as a measure for sustainable capital spending.
Another way these ratios differ is that one is used to gauge the company's debt and how well it can be repaid, while the other is used for growth.
Capex to Operating Cash Ratio vs. Cash Flow Coverage Ratio
The cash flow coverage ratio is another coverage metric that can be used to judge a company's financial risk.
Like the previous metric, the cash flow coverage ratio is better used as a relative metric than an absolute one.
The cash flow coverage ratio is calculated as follows:
Cash Flow Coverage Ratio = CFO / Total Debt
The cash flow coverage ratio shows how much CFO a company generated compared to its total debt. Higher the better.
This ratio is used as a risk metric on a relative or empirical basis. For example, suppose the ratio is below the industry average or historical level. It means the company produces less cash flow or has higher debt levels.
A lower ratio means that the company has a higher level of financial risk, and the valuation should be adjusted accordingly. Similarly, if the balance is consistently increasing, the company is expanding its CFO or reducing debt, which reduces the overall financial risk.
The main difference between these two ratios is that one is a coverage ratio with CFO in the numerator. This means it uses CFO as a metric to judge how much debt it can repay.
On the other hand, the Capex to Operating Cash ratio shows how much CFO the company utilizes to meet its capital requirements.


or Want to Sign up with your social account?