Economic Value of Equity (EVE)
Refers to a cash flow calculation that is produced by subtracting the present value of assets from the present value of liabilities


What is the Economic Value of Equity (EVE)?
EVE is a cash flow calculation that subtracts the present value of assets from the present value of liabilities. It is used mainly by institutions to find their net present value or assess their ability to pay off their debt in liquidation.

Likewise, it helps banks manage interest rate risk, which is a crucial area for monitoring. The Basel Committee on Banking Supervision suggests a stress test of plus or minus 2% on all interest rates.
The data for calculating this metric can be found on the cash flow statement, which is typically available on publicly traded companies' websites.
The cash flow statement is one of the primary financial statements companies issue to track their financial performance and exhibit their financial capability to investors.
EVE is important to financial institutions primarily because it aids in a better projection of interest rate risk and overall risk, which helps banks plan more efficiently for the future.
However, it can be difficult to calculate and, in turn, be inaccurate due to the complexity of some liabilities (ex: liabilities with options).
Value at risk (VAR) is another metric that measures risk. It differs from EVE due to specifically aiding in forecasting the risk of losses incurred, whereas EVE deals more specifically with interest rate risk.
However, banks use these crucial metrics to make more informed and efficient decisions.
- Economic Value Of Equity is determined by subtracting anticipated asset cash flows from expected liability cash flows, aiding banks in assessing net present value and debt management during liquidation.
- EVE is vital for modeling how interest rate changes affect a bank's capital, enabling stress tests and preparation for fluctuating interest rates.
- Economic Value Of Equity relies on the cash flow statement, a core financial statement tracking cash movement, providing insights into operations, funding, and transactions.
- EVE helps banks manage assets to cover liabilities promptly, reducing the risk of losses if liabilities aren't met on time.
- Economic Value Of Equity (EVE) and Value at Risk (VAR) both aid banks in making informed decisions, but EVE focuses on interest rate risk while VAR assesses various risks.
Understanding Economic Value of Equity (EVE)
EVE is the result of a cash flow calculation and is obtained by deducting the present value of all anticipated cash flows from assets from the Present Value of all expected cash flows on liabilities.
This value is utilized as an estimate of total capital when assessing how sensitive it is to interest rate changes. Banks commonly use this metric to build models that predict how changes in interest rates will impact their overall capital.
Interest rates directly affect the fair market values of a bank's assets and liabilities. Therefore, a bank builds models that include all of its constituent assets and liabilities to show how various interest rate changes may affect its overall capital.
This risk analysis is a crucial tool that enables banks to conduct stress tests and prepare for constantly fluctuating interest rates.
This metric can be used to find a bank or institution's Net Present Value (NPV). It allows banks to observe their assets and liabilities in the long run. Additionally, it is used as a tool to assess interest rate risk and other risk exposure.
The metric is crucial to a bank's asset liability management. Asset liability management is regulating an organization's assets concerning its cash flow to decrease the chance that the business will suffer losses if liability is not paid on time.
One of the manager's main responsibilities is ensuring enough assets are on hand to cover liabilities as soon as their due dates approach.
Economic Value Of Equity Formula
The visualized formula is as follows:
EVE = Present Value of Assets - Present Value of Liabilities
As shown by EVE, interest rates and the present values of liabilities are directly correlated. It suggests that rising interest rates correspond to rising current values of liabilities.
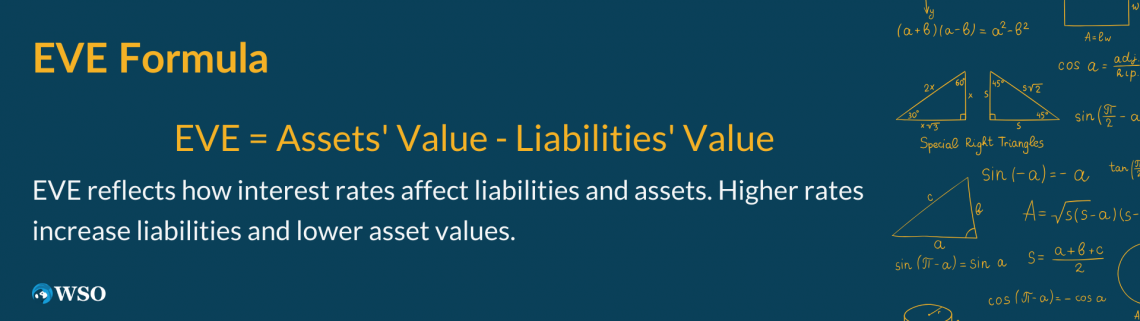
On the other hand, the EVE shows that interest rates and present asset values are inversely related. Interest rates will decrease as an asset's current value rises.
The U.S. Federal Reserve (EVE) requires regular assessment of the economic value of equity.
In addition, the Basel Committee on Banking Supervision recommends a stress test of plus or minus 2% on all interest rates. It is a recognized benchmark for determining interest rate risk.
Understanding the cash flow statement
As the EVE metric can only be calculated using a company's issued cash flow statement, it is important to understand the function of the statement.
The cash flow statement (CFS) recaps the movement of cash and cash equivalents in and out of the company.
The CFS analyzes how effectively a business manages its cash position or generates cash to cover its debt payments and finance its operating costs.
The balance sheet and the income statement are two primary financial statements, and the CFS is the third.
The cash flow statement provides information on the following:
- A company's operations
- Sources of funding
- Financial transactions
It can be used by investors, creditors, and management. For example, it aids creditors in determining how much cash is available (also known as liquidity) for the business to meet its operational costs and settle its debts.
Investors also find the CFS an important metric since it lets them know whether a company is financially stable. Therefore, they might utilize the statement. As a result, to decide on their investments in a more informed manner.
The Cash Flow Statement Components
Its main components are:

1. Cash flow from operating activities
The operating activities on the CFS comprise all revenue sources and expenditures resulting from commercial operations. In addition, it displays the revenue generated by a business's products or services.
2. Cash flow from investing activities
Any sources and applications of funds from a company's investments are considered investing activities.
This category includes any payments made in connection with mergers and acquisitions (M&A), asset purchases or sales, vendor or customer loans, and other payments. In addition, changes to investments, equipment, or assets are related to this category.
3. Cash flow from financing activities
The sources of cash from banks and investors and the methods of paying out cash to shareholders are all included in the money from financing operations. This consists of dividends, stock repurchase payments, and the corporation's principal loan repayments.
4. Disclosure of non-cash activities
This category is sometimes included when prepared under generally accepted accounting principles (GAAP). However, since it does not have cash, it is not part of the calculations and is thought of as more of a footnote.
Additionally, two methods for calculating cash flow are direct and indirect. The direct method totals all cash outlays and inflows, including cash paid to vendors, cash collected from clients, and cash received as salaries.
This CFS method is simpler for relatively small enterprises that employ the cash basis of accounting.
On the other hand, the indirect method involves computing cash flow by adding or removing differences from non-cash transactions from net income. Non-cash items can be seen in the shifts in a company's assets and liabilities from one period to the next on its balance sheet.
The accountant will identify any gains and losses in asset and liability accounts that need to be added to or deducted from the net revenue figure to calculate an appropriate cash inflow or outflow.
It is important to note that negative cash flow in one period does not immediately signal that the institution is going bankrupt. It can also mean investing in a project that will further add value, which is a positive sign.
Importance and Limitations of Economic Value of Equity
The stock's economic value determines the actual risk level as a going concern.
Interest rates work as a financial and investment activity benchmark, making it more generally beneficial in finance and economics.
Likewise, it is essential because it is employed to determine the extent of the bank's exposure to interest rate risk. It can choose the future financial capacity of a bank or financial institution.
Thus, it allows for more accurate future decision-making and policy-making because it is a long-term assessment.
Summarized important factors:
- Measures actual overall risk
- Measures the bank's exposure to interest rate risk
- Aids in better long-term decision and policy making
EVE can be less accurate when dealing with financial instruments with uncertain maturities and uneven cash flows.
Therefore, certain liabilities, such as complex products embedded with options, are open to interpretation and judgment by the financial modeler and can be difficult to calculate accurately and free from subjectivity.
Summarized limiting factors:
- It can be difficult to calculate complicated liabilities
- It can be inaccurate due to a lot of room left for interpretation with complex liabilities
What is value at risk (VaR)?
VaR is a ratio that determines the possible losses a company, portfolio, or position might face over a specific period. It is commonly used by investment and commercial banks alongside EVE to assess risk.
The ability to calculate the cumulative risks from positions held by various trading desks and divisions within the institution is made possible using a firm-wide VaR evaluation.
Using the data offered by VaR modeling, financial institutions can decide if they have enough capital reserves to sustain losses or whether higher-than-acceptable risks necessitate them to reduce concentrations.
The potential for loss in the factor being analyzed and the likelihood that the specified loss will occur is determined. It is computed by evaluating the prospective loss amount, the possibility that it will happen, and the period.
How To Calculate VaR?
VaR can be calculated in three different ways, which are identified as follows:
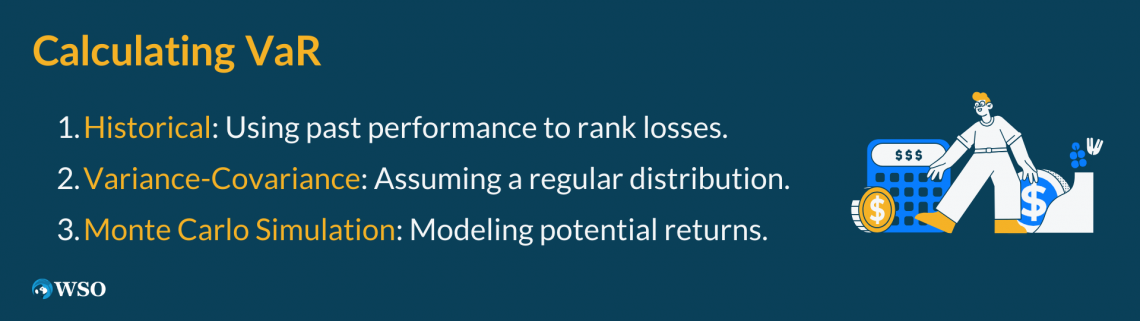
1. Historical approach
It starts with the assumption that past performance will influence future results and ranks one's prior performances from worst losses to best gains.
2. Variance-covariance
This approach assumes that gains and losses are regularly distributed rather than thinking that the past will guide the present. Potential losses can therefore be described in terms of deviations from the mean by a standard deviation.
3. Monte Carlo Stimulation
This method simulates anticipated returns across hundreds or thousands of potential iterations using computer models. The impact is then calculated based on the likelihood that a loss will occur, for instance, 5% of the time.
Economic Value of Equity (EVE) FAQs

An alternative to the EVE is the Net Interest Income (NII). As opposed to the EVE, which measures the long-term interest rate risk, the NII calculates the short-term interest rate risk. For reference, the NII formula is as follows:
NII = Interest Revenues - Interest Expenses
Both of these computations are used to assess risk by a financial entity. However, the VAR specifically deals with the risk of potential losses that could be incurred, whereas the EVE mainly deals with interest rate risk.
If the EVE is negative, it means that a company does not have sufficient funds to cover its liabilities in the event of liquidation. It can be a bad sign for a business and investors.
However, it does not paint the complete picture because having a negative or a lower EVE can be a product of the business's investing in future income-generating assets. Assets add value to the company and increase its EVE in the long run.
That is why managers and investors are advised to look at the ratios and metrics from multiple periods to assess the businesses' future financial capacity.


or Want to Sign up with your social account?