Momentum Investing
Investing money by observing the momentum and the overall trend in the security prices.


What Is Momentum Investing?
An investing strategy or technique where we invest our money by observing the momentum and the overall trend in the security prices.
Analyzing trends, chart patterns, and industry/sector movements is the crux of this investing style. In addition, it helps them to find the correct entry and exit points.
Before understanding further, we need to understand what a trend is and how important it is for momentum investing. A movement is the current direction of the market or security.
A trend can be positive, i.e., the asset prices go up; opposing, i.e., the asset price goes down; the trend also can be flat, i.e., there is no movement in the asset prices.
The trend can last for the short, the mid, or long term depending on the fundamental and technical indicators.
It plays a vital role in momentum investing by telling the right time to buy or sell the stock.
If a trend is identified successfully, it can give significant run-ups in relatively short periods. However, determining the direction entirely depends upon the analysts’ understanding and interpretation of available data.
So, It is a type of investing strategy that uses momentum and trend of the asset price rather than the fundamental analysis, which is more common in this industry to put their funds in the market.
There is one more thing used in this technique, known as divergence. It is the point or moment when the momentum or trend of the assets starts moving in the opposite direction, indicating the start of a new trend in the value.
The divergences are of many types, but the most important are bullish and bearish divergences. Bullish divergence is when the downtrend starts moving in the opposite direction toward the upward.
The bearish divergence is the opposite of the bullish divergence, where from an uptrend then, it starts moving toward a downtrend, indicating that in the future, the prices will decrease, which means an excellent time to sell.
- Momentum investing relies on observing trends and momentum in security prices rather than fundamental analysis, making it suitable for short-term gains.
- Key technical analysis tools like RSI, MACD, Rate of Change, Stochastic Oscillators, and ADX aid in identifying entry and exit points for momentum traders.
- Advantages include potential for significant short-term profits and leveraging market volatility, but it comes with risks such as high turnover, taxation on short-term gains, and ignoring fundamental company analysis.
- Before adopting momentum investing, investors should thoroughly understand its principles, risks, and the tools involved, and consider consulting with experienced mentors or experts in the field.
The Father Of Momentum Investing
The concept of Momentum investing was popularized by the work of the American economist and investor, Benjamin Graham, often referred to as the "father of value investing.
While Benjamin Graham is best known for his value investing principles, which focus on buying undervalued stocks, he acknowledged the validity of Momentum investing as an alternative strategy.
Graham recognized that Momentum investing could offer higher returns but also comes with increased risk, as it relies on market trends and investor psychology rather than fundamental analysis of a company's intrinsic value.
Benjamin Graham's contributions to the field of investing, including both value and Momentum strategies, have had a lasting impact on the way investors approach the markets and analyze stocks.
Elements Of Momentum Investing
Here are the key elements of Momentum investing:
1. Price Momentum
Momentum investing focuses on stocks or assets that have exhibited strong price performance over a specific period. This can be measured using various metrics such as price returns over the past weeks, months, or even years.
2. Relative Strength
A crucial element of Momentum investing is assessing the relative strength of a stock compared to its peers or the broader market. Stocks demonstrating stronger relative strength are often favored for investment.
3. Trend Following
Momentum investors typically follow trends in stock prices, buying assets that are trending upwards and selling or avoiding those that are trending downwards. This strategy capitalizes on the idea that trends tend to persist in the market.
Momentum investing contrasts with traditional value investing by focusing on buying assets that have shown strong price performance recently, regardless of their fundamental value.
4. Quantitative Analysis
Momentum investing often involves rigorous quantitative analysis to identify stocks with strong momentum characteristics. This may include statistical models, technical indicators, and screening tools to pinpoint potential investment opportunities.
5. Risk Management
While Momentum investing can offer the potential for high returns, it also comes with increased risk. Effective risk management is essential, including setting stop-loss levels, diversifying across multiple assets, and managing position sizes to mitigate potential losses.
6. Behavioral Finance
Momentum investing is influenced by behavioral finance principles, particularly the idea of herding behavior and investor sentiment. Stocks with strong momentum often attract attention from investors, leading to further price appreciation due to increased demand.
Technical Analysis Tools in Momentum Trading
Until now, you have learned about this strategy, how it works, what we use, and its advantages, but nothing is mentioned about how to apply it and its tools. The answer to that is given below:-
1. RSI ( Relative Strength Index)
It is the indicator used to find a stock's current and historical strengths and weaknesses based on the closing price of a recent trading period. J. Welles Wilder invented it.
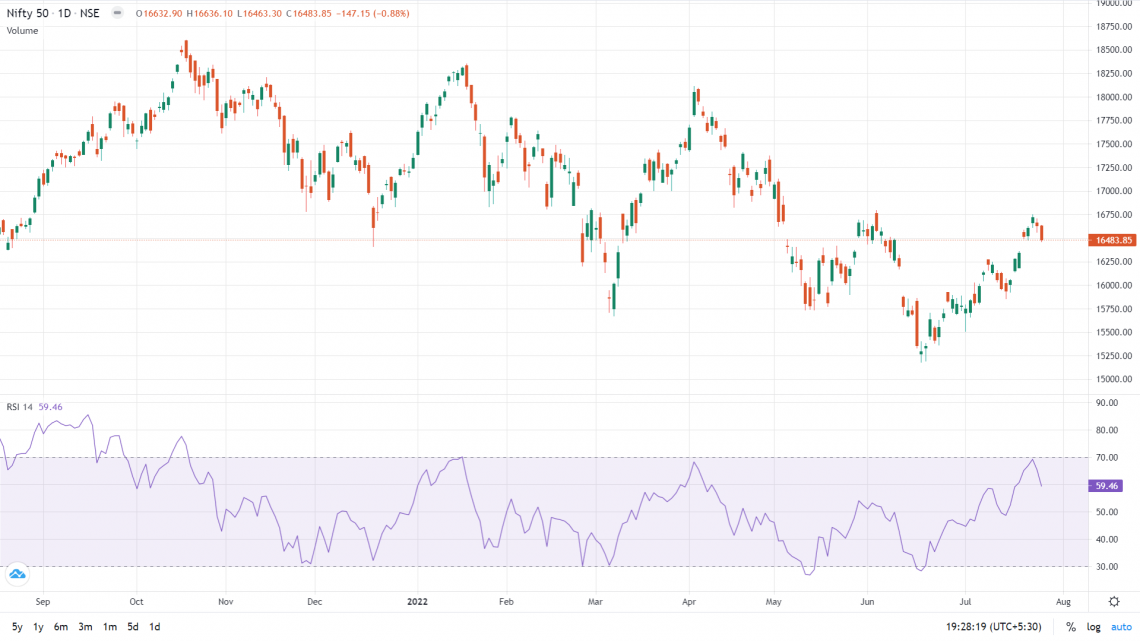
It signals to investors if the stock they buy is oversold or overbought. If the share is oversold, it is right to buy, and if the claim is overbought, it is time to sell.
It is measured on a scale of 0-100. From 0-30 is the lowest on the scale and is considered oversold, and 75-100 is considered an overbought time to exit.
2. MACD (Moving Average Convergence Divergence)
It is an indicator of one of the most popular and common tools used to indicate the relation between two moving averages. It's default setting is between 12 periods EMA to 26 periods EMA, where nine period EMA is the signal line.
Gerald Appel discovered it in 1973 to find the right buying and selling spot for the trader and does not tell whether the asset is oversold or overbought. The calculation for MACD is as follows:-
MACD= 26 period EMA -12 period EMA
EMA stands for Exponential Moving Average, a moving average (MA) that places greater importance on the most recent data points of price change.
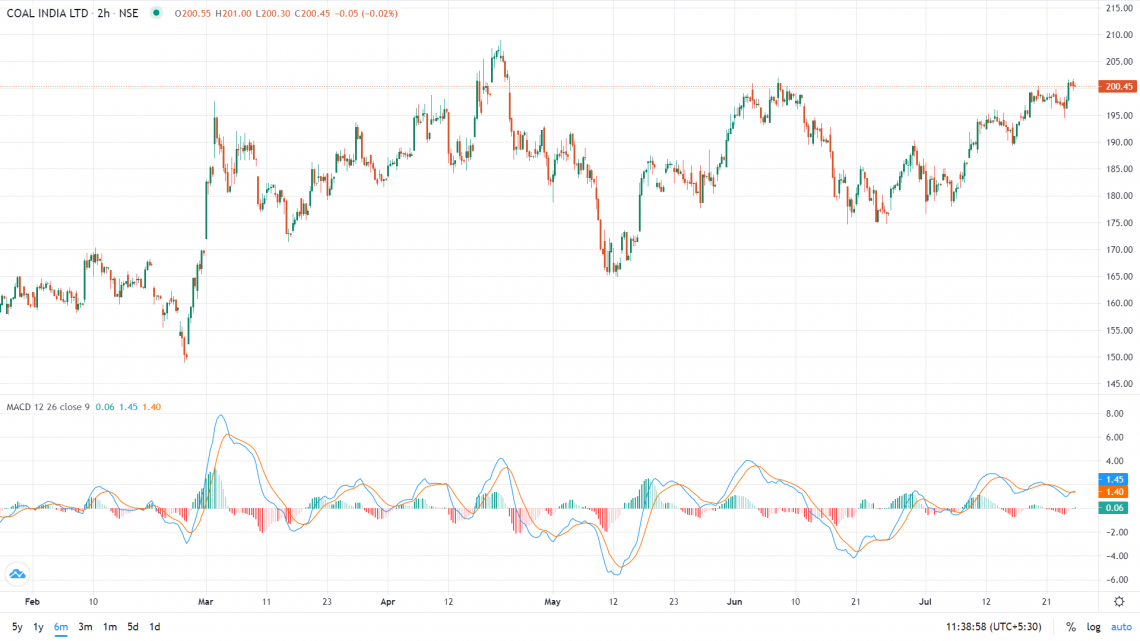
An effortless way to use it is to see the point where MACD starts going up from zero means time to invest, and when it goes down towards zero, it is bearish means exit time.
3. Rate of change
This tool is used to determine the rate or speed of change in the prices of securities. It tells the speed of the pierce fluctuation in the market. It helps to control your risk or reduce it.
It is a technical indicator created by Tom Demark to know the volatility of the stock and mentioned in this book, “The Book of Trading Strategies.” The formula of this is as follows:-
Rate of change= Current ValuePrevious value -1 *100
To use it, you need to decide a value according to your risk appetite, whether you can or can take that much risk. For example, suppose if, for a stock of $100, Mr.A has a risk appetite of $15, so he can take a chance of $15 if the share value decreases.
Behavioral finance principles, such as herding behavior and investor sentiment, play a significant role in momentum investing, driving price movements as investors chase past winners.
4. Stochastic Oscillators
It is a tool used by momentum traders to know that the asset is oversold or overbought, which gives them the right call for buying and selling the stock or currency.
It was discovered and developed by George Lane in the late 1950s for doing technical analysis of shares. It is also used in many indicators as a basis, like RSI.
The term stochastic refers to the point of a current price concerning its price range over a while. This method attempts to predict price turning points by comparing the closing price of a security to its price range.
It helps to find the stock's right buying and selling points by telling if it is oversold or overbought. Stocks below zero are over oversold, and above a hundred are overbought.
5. ADX (Average Directional Movement)
It is one of the tools used in the technical analysis of stock and currency. It analyzes different movements in the stock prices and tells the market value and cost trend fluctuation.
It was developed in 1978 by J. Welles Wilder and is used to primarily identify the strength of a trend and determine when it will stay or go in the opposite direction.
It measures the trend's strength and whether the price is in a trading or non-trading movement. It does not determine whether the trend is bullish or bearish, but it measures the power of the current trend.
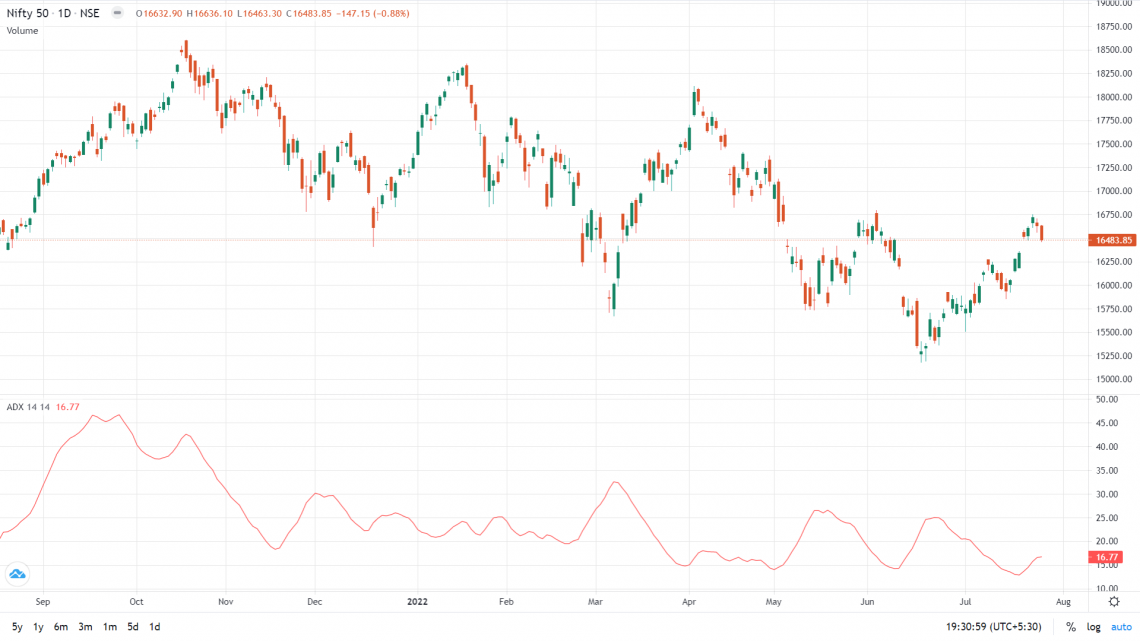
It is measured from 0-100, where 0-20 is not a good trend, 20-45 is good, 45-60 is better, and 60-100 is the best trend strength, and it means that if it is bullish, then buy, and if bearish then sell.
Ultimately, it is crucial for the trader first to learn and acquire knowledge about all of these tools and this strategy thoroughly and learn to form a good mentor and industry expert before investing.
Momentum Investing Advantages
Following are the benefits of momentum investing
1. Rapid Profit Generation
This type is more effective and efficient in the short term than traditional value investing, which says buy when the price is less and sell when it is high.
It works very well in a short period as by doing the trend analysis, you can easily find the up and down in the price of assets to find the right spot to buy and sell these securities to book huge gains.
Divergence also plays a vital role as it tells the spots where the inflows in assets change suddenly.
While some investors swear by momentum investing's ability to generate outsized returns, others criticize it for its potential to fuel market bubbles and exacerbate volatility, highlighting its polarizing nature within the investment community.
2. Leveraging Market Volatility
The volatility in the market plays a crucial role in this strategy. It is all about taking leverage of the volatile market trend.
If the bottom and top of a volatile market are correctly identified, the momentum strategy can be used to allocate the money at the bottom and take it out at the peak of the trend.
Volume is the most crucial metric at this stage as it shows the inflows and outflows in the particular asset.
Momentum Investing Disadvantages
We have read about this type of investing technique, how it works, details, and contributors. We also know the different advantages and why we should follow this strategy.
After all of this, our question was how to start and what tool helps. Now follow this strategy's disadvantages so you know both sides of the coin.
1. It is a hazardous strategy
As it works based on the changes happening, the prices of the assets are backed by only the supply and demand principle of economics, which no one can control.
We cannot predict if the market sentiment for the stock is bullish or not, which makes it highly risky. But, yes, momentum investing is an excellent strategy to support, and it can make you more profit in the short term.
Momentum investing relies heavily on quantitative analysis, including statistical models, technical indicators, and screening tools to identify high-momentum stocks or assets.
It will play for you, but you cannot predict or guess future prices with 100% surety based on trends because the market is very volatile, so you need to measure your risk before entry.
2. High Costs and Turnover
Short-term capital gains are taxed at a higher rate than long-term capital gains.
It results in paying more expensive fees and taxes for this practice, which decreases your profits after tax. It is a huge problem; why do people not use this type of investing?
Although the new discounted broker tries to solve this by charging fewer fees than the traditional one, the charges are still more than LTCG on their platforms, which remains a significant concern.
3. Neglect of Fundamental Analysis
There are so many other factors that you have to see before investing in something. For example, if you consider only the price-changing behavior of the stock, then maybe you end up buying stocks of a lousy company.
You may earn profit from that right now, but if the company's terrible, it will eventually go down or perform opposite to the trend, ultimately losing your money.
Momentum investing requires continuous monitoring of market trends and adjustments to portfolios to capitalize on changing market conditions, making it adaptable to evolving market dynamics.
Considering other factors is essential when putting your money in the market because you never know when it will backfire on you, it is better to invest wisely than in an insufficient stock.
Now you have learned everything you need to know before investing through the Momentum strategy, from basics to the application of tools used in this and its advantages and disadvantages.
Conclusion
Momentum investing offers a compelling strategy for traders seeking short-term gains by capitalizing on market trends and momentum.
However, its success hinges on a deep understanding of technical analysis tools and careful consideration of associated risks, including high turnover and taxation on short-term gains.
While momentum investing can yield significant profits in volatile markets, investors must remain vigilant and acknowledge the strategy's inherent hazards, such as its reliance on market sentiment and the potential disregard for fundamental company analysis.
By staying informed, utilizing appropriate tools, and exercising discipline, investors can navigate the complexities of momentum investing and maximize their chances of success in the dynamic world of financial markets.
Momentum Investing FAQs
Simply put, it is a strategy to invest in the stock by analyzing its price trend.
Richard Driehaus is considered the father of it.
It helps earn more in the short term and is much more efficient than traditional ways.

Free Resources
To continue learning and advancing your career, check out these additional helpful WSO resources:


or Want to Sign up with your social account?