Stock Screener
It allow investors to filter stocks based on metrics they would like to see.


What is a Stock Screener?
A stock screener is a tool or software that filters and sorts stocks based on specific criteria, helping investors identify potential investments that meet their preferences and goals.
Every investor has an opinion of what makes a good prospective investment. Some prefer low volatility and a higher dividend, while others may favor more volatility and content with a lower dividend yield.
As a result of every individual having their own opinion, stock screeners allow investors to filter stocks based on metrics they would like to see. There are dozens of stock screeners available on the internet, and while some of them require a subscription fee, numerous free sites offer them as well.
Some of the most popular free screeners are:
Both investors and traders use stock screeners to find potentially profitable long investments or short positions. There is an abundance of filters that you can use with a screener. The more filters you apply to your search, the smaller the pool of stocks is.
There are plenty of options for filters, allowing each investor to search relative to what they are specifically looking for in an investment. You can apply multiple filters if you are looking for a specific investment, or you can filter by a single component, like the industry, if you are browsing for stocks.
Note
The accuracy and timeliness of the data used by stock screeners can vary, leading to potential discrepancies or outdated information that may impact investment decisions.
There are thousands of publicly traded companies, so narrowing this pool of stocks down to ones that fit your investing profile can be invaluable. In what used to take hours to find information manually, data can be filtered in seconds with a screener.
A screener includes three main components.
- The database of listed stocks
- Search parameters
- The screening engine that filters the stocks
While quantitative data is valuable for analysis, stock screeners may overlook qualitative factors crucial for making informed investment decisions, such as industry trends, company management, or competitive advantages.
- Stock screeners are tools or software that filter and sort stocks based on specific criteria, assisting investors in identifying potential investments aligned with their preferences and goals.
- Investors can tailor their searches using various filters such as price, 52-week price % change, market cap, region, sector, and industry, among others, ensuring the selection aligns with their investment criteria.
- Stock screeners save time by quickly filtering out stocks that do not meet the specified criteria, enabling investors to focus on analyzing a refined selection of potential investment opportunities.
- Stock screeners remove biases, uncover opportunities, and track stocks efficiently but can be overwhelming with numerous filters, rely heavily on quantitative data, and may have data currency issues.
How to use a stock screener
It can be overwhelming when you first open a stock screener. There are often dozens of criteria to choose from, multiple types of screeners, and technical data. This section will break down how to use a screener.
Finding a screener can be difficult, but you should look for one with an interface that is right for you. You should also decide if you are looking for a free screener or one that requires a subscription. Screeners with subscriptions are often more advanced.
You can decide whether you need a free or fee-based screener depending on what criteria you plan on searching for. For most casual investors, a free screener should provide a plethora of filters, while more advanced traders may want to pay for a subscription.
You should also research to ensure that the screener is a reliable source of information. Reading customer reviews can be beneficial while searching for a screener that is right for you.
Throughout this article, we will use the free TradingView screener.
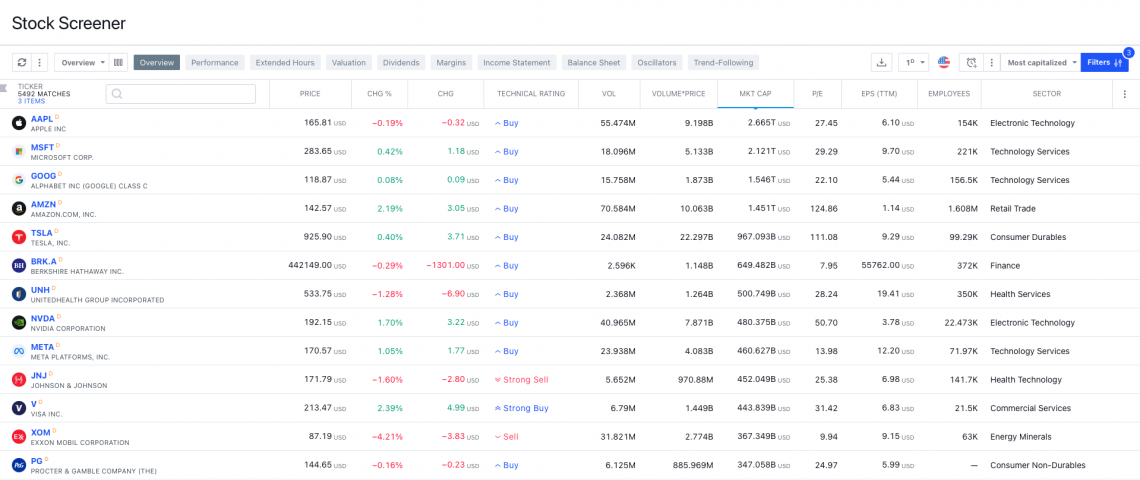
As can be observed above, the list is currently organized based on market capitalization, with the largest companies at the top. Next to the filter button in the top right corner, you can change how the list is organized by numerous metrics such as:
- Top gainers
- Volume leaders
- High-dividend
If you want to add a filter, go to the blue filter button in the top right corner.
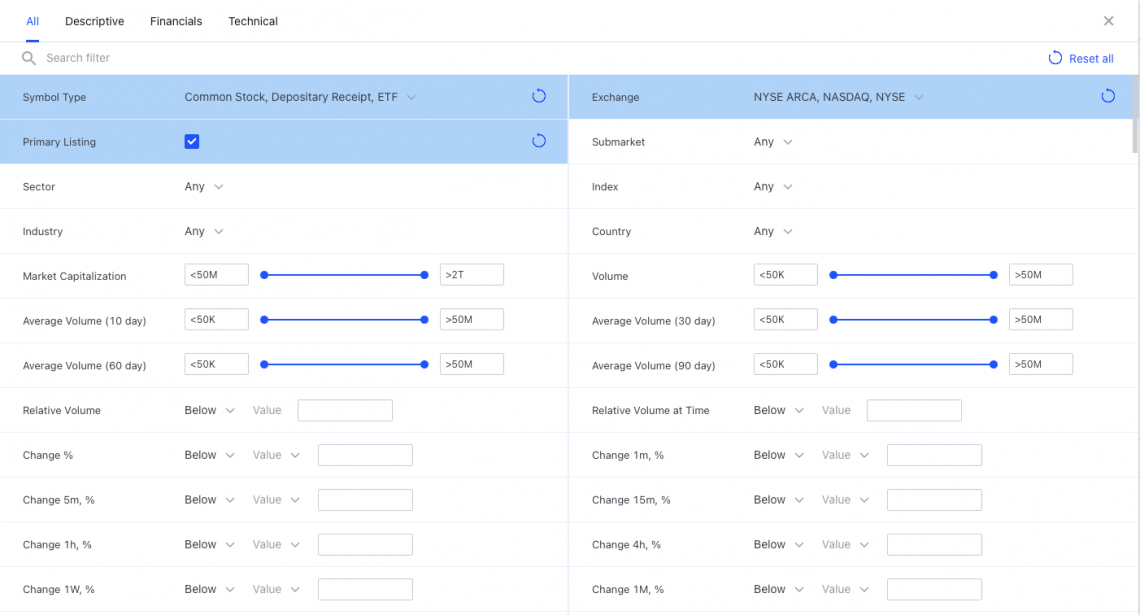
This screenshot includes only some of the possible filters to choose from. Currently, there are three filters applied as the default:
- Symbol type
- Primary listing
- Exchange
This is evident because the box is highlighted in blue color, meaning a filter is applied for that category.
The filter options can be intimidating with criteria such as price/book value (P/B) or operating cash flow ratio. Below are some of the most common criteria and a brief explanation.
Some sites also have predefined screens that include searches with variables already entered. This can be helpful for an investor who is lost on what to search for.
The following sites offer predefined screens:
Always ensure that you do your due diligence when investing, as just because a screener gives you securities that align with your criteria doesn’t mean they are always a good investment.
Example of a Stock Screener
Let’s say you want to look at large-cap technology companies in the United States (greater than $10B) because we are looking for a safer investment. Your screen would look like this:
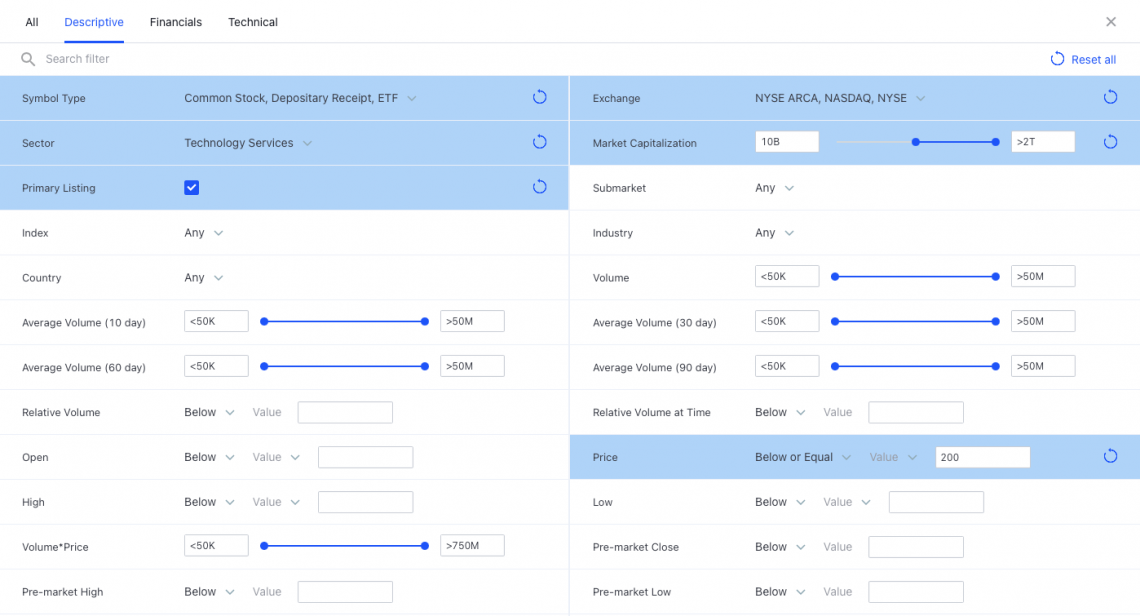
With these filters, we now have 61 matches. In other words, 61 stocks match our criteria. This is too broad, so we will continue to narrow our search.
Because we are looking for a safer investment, we would prefer lower volatility. Beta is a measurement of volatility relative to the overall market. A beta of less than 1 means the stocks are less volatile than the market, which is what we want. After adding that filter, we now have 19 matches.
To narrow our search even further, we want a company with a low debt-to-equity ratio (MRQ) because this means they are less leveraged. Although we understand they may not grow as much, lower debt is a sign of financial security for a company.
It depends on the industry, however, generally, a low debt to equity ratio is around 2, but we are going to set our ratio to less than 0.5. This now leaves us with nine matches.
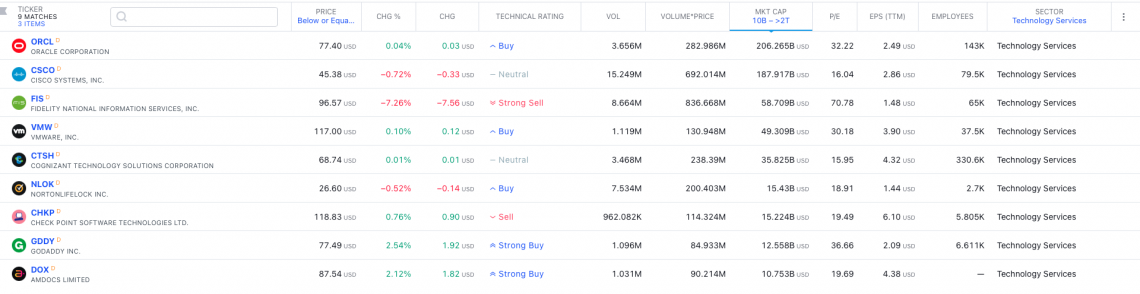
We can now look at other factors to consider which companies we would like to invest in. Now, we have a short list of large-cap companies with a small amount of debt and low volatility and currently priced at under $200 per share.
Advantages of Stock Screener
There are advantages and drawbacks to using a stock screener. Some people may use a screener for every investment, while some may never use one.
Using a stock screener is a preference, and you should consider what you are looking for in an investment and decide if a screener is something you would like to use. Some of the advantages include:
- A screener can save time by filtering out stocks you are not interested in based on some defined criteria. Then, rather than looking through a company’s financial data, which can be time-consuming, stock can be filtered by the criteria in seconds.
- By searching based on quantitative data, a lot of the behavioral biases are removed from the equation. For example, emotional investing can often lead to lesser returns.
- Screeners can help you identify hidden gems or stock you wouldn’t have found without the technology. You may have criteria in mind that are fulfilled by a stock you have never heard of before but could be a valuable investment opportunity.
- These screeners can assist in tracking stocks by saving your search and parameters. As a result, it saves time and allows you to keep an eye on stocks based on defined metrics.
Note
Predefined filters in stock screeners may limit investor's ability to customize searches based on unique investment strategies or evolving market conditions, reducing their effectiveness in certain scenarios.
disadvantages of Stock Screener
Despite their utility in filtering and identifying investment opportunities, stock screeners also present certain drawbacks that investors should be aware of. Some of the disadvantages include:
- Because thousands of stocks are listed on every exchange, it can be difficult to narrow your search. For example, you may filter your search by four factors, but it could still result in over one hundred.
- While quantitative analysis can be the most effective method of evaluating a stock, sometimes qualitative elements are informative as well. For example, it would be wise to know if a company is facing lawsuits or corporate governance issues.
- The accuracy and timeliness of the data used by stock screeners can vary, leading to potential discrepancies or outdated information that may impact investment decisions because the dataset is not updated regularly.
- Stock screeners may not capture all relevant factors influencing a stock's performance, potentially leading to missed opportunities or inadequate risk assessment.
Stock Screener Filters
Below are some of the most common filters aside from index, price, and sector. These brief explanations can provide a better idea of the criteria you may want to utilize. Remember that there are dozens more options depending on the screener you use. Some of the most used options include:
1. Market Capitalization
Market cap is the value of a company and is calculated by multiplying the total number of shares by the current price per share. Large-cap companies tend to be the most well-known and profitable companies.
2. Price-to-Earnings ratio (P/E)
The P/E ratio is calculated by dividing the share price by earnings per share. A lower P/E ratio generally means that the stock is a better value. A stock with a P/E ratio under 15 is undervalued, but P/E shouldn’t be used alone.
3. Book Value per Share (BVPS)
The BVPS is calculated by dividing the company’s common equity by the number of shares outstanding. It is essentially a per-share measurement of a firm’s net asset value. A lower BVPS (under 1.0) typically means the stock may be undervalued.
4. Price-to-Book Ratio (P/B)
The P/B ratio compares the company’s current market value to its book value. A P/B ratio of more than 1 means it is being traded at a premium compared to the company’s book value.
5. Price-to-Sales Ratio (P/S)
The P/S ratio calculates the company’s market capitalization by the most recent year’s revenue. A P/S less than 1 means that, for every dollar invested by shareholders, there’s another that the company earns every year.
Note
Due to the complexity of market dynamics, stock screeners may produce false positives, highlighting stocks that meet the selected criteria but fail to deliver desired outcomes in reality.
6. Price/Earning-to-Growth Ratio (PEG)
The PEG ratio is calculated by dividing P/E by the growth rate of the company’s earnings over a period. A PEG over one typically means the stock is overvalued. This ratio determines the value of the stock while also factoring in the future expected earnings growth of the company.
7. Free Cash Flow (FCF)
FCF is the amount of cash left over after the company pays for its operating expenses and capital expenditures. More free cash flow is a sign the company is generating more cash than they need to sustain and grow the company, which is a sign of a strong stock.
8. Beta
Beta is an indicator of volatility compared to the market the security is listed on. A beta of 2 means the price of that stock is 200% as volatile as the market. A beta less than one is considered less volatile than the market.
9. Volume
Volume is the number of shares of an asset that is traded over a period of time. A higher volume is typically a sign of bullish trading.
10. Forward Dividend Yield %
This is the expected dividend yield, as a percentage of the current share price, that a company expects to pay in the form of dividends over a period.
11. Earnings per Share (EPS)
EPS is calculated by dividing a company’s profit by outstanding common stock shares. This is an indicator of profitability. Typically, the higher the EPS, the more profitable the company is.
12. Earnings Before Interest and Taxes (EBIT)
EBIT is calculated by subtracting expenses (except tax and interest) from the company’s revenue.
13. Earnings Before Interest, Taxes, Depreciation, and Amortization (EBITDA)
EBITDA is the company’s revenue before deducting interest, taxes, depreciation, and amortization. EBITDA allows for easier comparison of companies because it eliminates some extraneous factors. A higher EBITDA value typically means the company is more profitable.
14. Momentum
Momentum indicates the trend of the change in the stock and the velocity at which it is trading. It is the rate of change in price movement. High momentum stocks rise in price quickly over a shorter period. Unexpected crashes can also accompany these stocks.
15. Stock Float
Stock float is the number of available shares for the public to buy and sell.
Stock Screener FAQs
A screener is a tool that allows you to narrow your broad search of thousands of stocks based on defined criteria. There are hundreds of criteria to search by but which to use is ultimately up to the individual.
These screeners search solely based on qualitative indicators, such as specific ratios or changes in performance.
Screeners can be excellent tools for preliminary research, creating a watchlist, and discovering unknown stocks.
It is at the discretion of each individual whether they would like to use a screener. They have their advantages and drawbacks but can be valuable tools to save time in the research process.
You can view a screener whenever you are looking for new investment opportunities or establish a watchlist of potential securities.
Picking the right stock is something every investor wishes they could do. Investing in a stock that goes on to have high returns is the ideal scenario, but it is not always the case because investing always comes with risks.
The right stock can also be an asset that aligns with your investing profile, time horizon, or morals. There are numerous elements of a stock, which is why each investor is unique in their decision-making for investing.
While stock screeners can be an excellent resource for researching stocks, you still must decide for yourself if an investment can be profitable.
There is no single best stock screener, but it depends on each investor. Some may prefer free versions, while others may require more advanced search options.
Always ensure that the screener you use regularly updates its database because outdated information is no longer useful.


Free Resources
To continue learning and advancing your career, check out these additional helpful WSO resources:


or Want to Sign up with your social account?