VIX
Estimates the market volatility for next 30 days using data from SP500 Index


What is the VIX?
The VIX (Volatility Index) is an index that measures expected volatility on the S&P500 for the next 30 days. It can be traded like an asset on the Chicago Board Options Exchange. It is calculated from the trading of options for the next 30 days.
For example, if a large amount of calls and puts with exercise prices are a long way away from the current market prices, then the expectation is that there will be volatility and the VIX will be high. Generally speaking a VIX higher than 30 implies high volatility whilst a VIX below 20 implies stability.
The rate at which the price of a stock rises or falls over a specific time period is known as volatility. Increased risk is frequently associated with higher stock price volatility, which also aids investors in forecasting potential future swings.
The CBOE Volatility Index, in the opinion of many, is the most reliable global indicator of the volatility of the equity market.
The index, which is calculated using the current pricing of options on the S&P 500 Index (SPX), aims to reflect investor expectations for the 30-day predicted volatility of the stock market.
The index is commonly referred to as the "fear gauge" of the market.
Key Takeaways
- Volatility Index (VIX) predicts S&P500 volatility; above 30 means high, below 20 signals stability.
- Based on S&P500 options trading, VIX reflects market expectations for future 30-day volatility.
- Traders go long on VIX for rising volatility, short for stable markets. Volatility impacts option prices, shaping trading decisions.
- VIX below 12 signals low volatility, 13-19 is typical, and 20 or higher indicates increased volatility, often linked to market stress or major events
- While not perfect, VIX provides insights into future market volatility. Unexpected events can disrupt predictions, emphasizing the need for flexibility in trading strategies.
Understanding Volatility Index (VIX)
The volatility index serves as the centerpiece of CBOE Global Markets' volatility brand, which also comprises other strategy and performance-based indices and tradable volatility products, including Volatility Index options and futures.
It measures how much an underlying index is expected to move in the near future based on the order book of the underlying index options (measured as annualized volatility, given in percentage, e.g., 20%).
The CBOE Volatility Measure, a live index, reflects the market's predictions for the relative strength of impending price fluctuations of the S&P 500 Index (SPX). Because it is derived from the pricing of SPX index options with near-term expiration dates, it generates a 30-day forecast of volatility.
When making investing decisions, investors use the Volatility Index to gauge the level of risk, anxiety, or tension in the market.
Traders can price derivatives using VIX values, or they can trade it using a range of options and exchange-traded products. It often goes up when stocks are down and down when they are up.
It is crucial that this statistic accurately reflects projected volatility. Instead of being a precise indicator of volatility, it is based on the premiums that investors are prepared to pay for the chance to buy or sell a stock.
The premiums for options can be viewed as a representation of the market's perceived amount of risk. People are more willing to pay for "insurance" in the form of options the higher the risk. The volatility index decreases in tandem with falling option premiums.
History of the VIX
The index was established as a weighted measure of the implied volatility of eight S&P 100 at-the-money put and call options in 1993 when the derivatives industry was still in its infancy.
As the derivatives markets developed ten years later, in 2003, the CBOE worked with Goldman Sachs to update the algorithm to compute Volatility Index in a new fashion.
The S&P 500 Index was then utilized to generate a wider range of options, which gave a more accurate representation of investors' expectations for future market volatility.
A methodology was decided and is still applied to the computation of several additional volatility index versions.
When the volatility rises above 20%, the market becomes more unsteady and scared, which denotes a higher risk environment. The 2008 Financial Crisis saw an exceptional increase in the volatility index to almost 50%.
This indicates that, on average, options traders predicted that stock values would fluctuate dramatically over the course of the following year, between an upswing and a downswing of 50%. The indicator reached an all-time high of 85% during the crisis.
The S&P 500 Index's future volatility and option pricing are thought to be accurately reflected by the VIX.
Guide for Trading the VIX
It opened the door for the trading of volatility as an asset, albeit through derivatives. In March 2004, CBOE introduced the first exchange-traded futures contract based on the volatility index. In February 2006, options were introduced.
These VIX-linked instruments only provide exposure to volatility and have given rise to a new asset class.
Introduced in 2009 and 2011, volatility-based securities have proven to be quite popular with the trading community for directional and hedging plays.
The purchasing and selling of these products have, in turn, had a profound effect on how the original index operates, changing it from a lagging into a leading indicator.
Active traders, significant institutional investors, and hedge fund managers use volatility-linked securities to diversify their portfolios because historical data shows that volatility and stock market returns have a strong inverse relationship.
Active traders should constantly monitor the real-time Volatility Index on their market screens to compare the trend of the indicator with the price movement of the most widely traded index futures contracts.
These instruments' convergence-divergence correlations produce a number of expectations that aid in trade planning and risk management.
In other words, when stock returns decline, volatility increases, and vice versa. To trade the Volatility Index, you have to go through the following steps:
- Find out how the index functions.
- Choose whether to go long or short on the volatility index.
How VIX works
Instead of the stock market itself, the volatility index tracks the price at which S&P 500 options are exercised. You can read more about S&P 500 options, the VIX's calculation, and its significance below.
Expectations to keep in mind while trading the volatility Index:
-
A bearish divergence that foretells declining risk appetite and a strong likelihood of a downside reversal is created by the Volatility Index increasing combined with rising S&P 500 and Nasdaq 100 index futures prices.
-
A rising Volatility Index combined with declining index futures for the S&P 500 and Nasdaq 100 increases the likelihood of a day with a downward trend.
-
Rising risk appetite and a high likelihood of an upside reversal are predicted by a positive divergence that is created by a declining Volatility Index together with declining S&P 500 and Nasdaq 100 index futures prices.
-
A falling Volatility Index in combination with rising S&P 500 and Nasdaq 100 index futures prices increases the likelihood of an uptrend day.
-
Lowering predictive accuracy, and divergent (uncorrelated) activity between S&P 500 and Nasdaq 100 index futures prices frequently results in whipsaws, confusion, and range-bound circumstances.
The Standard & Poor's 500, a capitalization-weighted index of 500 US equities, serves as the basis for the values of S&P 500 options, which are measured by the Volatility Index.
They grant the trader the right to trade the S&P 500 at a specified price and before a specified expiration date, but not the responsibility to do so.
A put option would allow you to sell the S&P 500 at a specified price, and a call option would allow you to buy the index at a specific price. The strike price is the price you determine to purchase or sell the underlying market at.
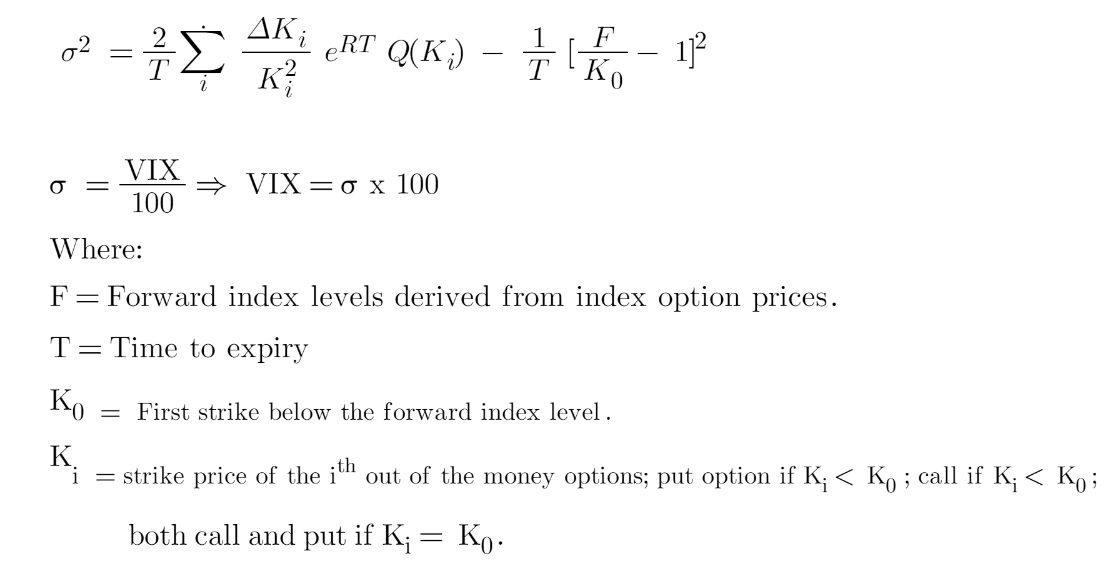
How is the VIX calculated?
S&P 500 options, including conventional CBOE SPX options, which expire on the third Friday of the month, and weekly CBOE SPX options, which expire on Fridays, are used to calculate volatility in real-time.
An option's expiration date must be between 23 and 37 days away in order for it to be included in the volatility index.
And,
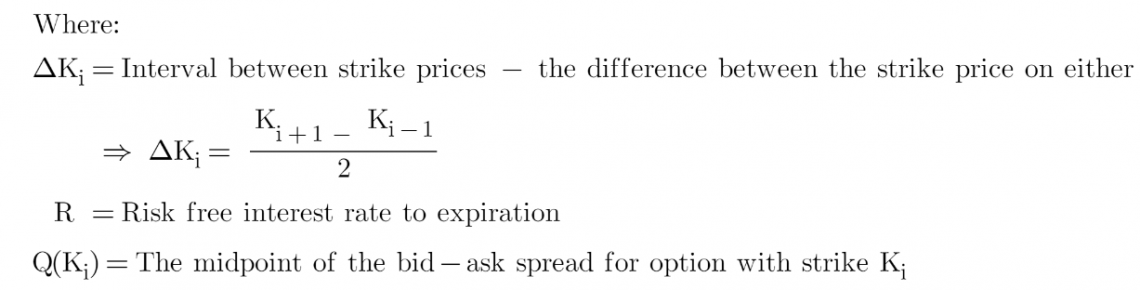
Although it is not necessary for every trader to comprehend this in order to trade the index, the calculation of the volatility includes exceedingly difficult mathematics.
The calculation's fundamental assumption is that by aggregating the weighted values of numerous S&P 500 put and call options over a wide variety of strike prices, we may learn what prices traders are prepared to buy and sell the S&P 500 at.
The S&P 500's expected future volatility will be calculated using these final numbers.
The options that are eligible for inclusion will be in the money since they demonstrate how the market perceives which strike prices will be reached prior to expiration. This thus reveals the general market mood on the movement of the market price.
Understanding the VIX values
The VIX and stock market returns have a significant inverse relationship. If the Volatility Index rises, rising investor apprehensions are probably causing the price of the S&P 500 to decline.
If the volatility index falls, the S&P 500 is probably experiencing stability, and investors are probably not under too much stress. Trading volatility is not the same as a market downturn because volatility can fall while the market rises.
Rather than the price of the item itself, volatility is a measurement of the price fluctuation of an asset.
This means that while trading volatility, you are more concerned with how much the market has changed than with the direction of change. Because of this, volatility readings are expressed as percentages.
For a number of years, the market was thought to be stable if the VIX was trading below 20, whereas readings of 30 or higher signaled extreme volatility.
The Volatility Index is believed to be able to forecast peaks and bottoms in the SPX: when it hits extreme highs, this is interpreted as a hint of upcoming bullish pressure on the S&P 500, and when it reaches extreme lows, this is interpreted as negative for the S&P 500.
There is even a saying that says it is time to purchase when the VIX is high.
Like all indexes, there is no tangible item to purchase or sell while trading it; thus, you are not directly trading an asset. Instead, you can trade the index using derivatives that are made to follow the volatility index's price.
Going Long or Short on VIX
When placing a wager on the VIX, you have a choice between two main positions: long or short. It's critical to remember that since they stand to gain from either outcome, volatility traders are more interested in market volatility than S&P 500 price movement.
A) Going long
Your choice of position will be influenced by the level of volatility you anticipate. Traders that go long on the volatility index do so because they think that volatility will rise and that the Volatility Index will climb as a result.
When there is a lot of stress and uncertainty in the market due to financial instability, going long on the Volatility Index is a well-liked option.
Take a long view of volatility, for instance, if you anticipated that the S&P 500 would drop significantly and quickly after a political statement. By initiating a trade to purchase the Volatility Index, you may achieve this.
B) Going short
By shorting the index, you are essentially wagering on the S&P 500's value rising. Shorting volatility is highly common when interest rates are low, the economy is growing at a fair rate, and there is little market volatility.
Let's assume that the S&P 500 constituents' share values have been steadily increasing as a result of the combination of strong economic growth and minimal volatility.
With the hope that the stock market will keep increasing and volatility will stay low, you can choose to short volatility.
The level of volatility is probably going to fall to a lower level if the S&P 500 does climb, and you could take a profit. However, shorting volatility is inherently dangerous because an increase in volatility could result in unlimited loss.
Interpreting the Volatility Index (VIX)
Since it uses the S&P 500 index as a proxy for the entire market, the CBOE Volatility Index, sometimes known as the "Fear Index," reflects the degree of anxiety or tension in the stock market.
With readings above 30, it indicates extremely high levels of uncertainty, and the higher it rises, the more fear and apprehension there is in the market.
You may wonder if the level of the Volatility Index affects the option premiums. Yes, it does. One of the key elements influencing the values and premiums of stock and index options is volatility.
Given that it is the most frequently followed indicator of overall market volatility, it has a significant effect on option premiums or prices.
Higher volatility indicates higher options prices (and hence, larger option premiums), whereas lower volatility indicates lower options prices or lower premiums.
The volatility index has a long-term average of approximately 21. It can indicate higher volatility and panic in the market at high levels (often when it is above 30), which are frequently linked to bear markets.
A volatility reading of well over 20 percent indicates rising market apprehension and a higher-risk environment. The volatility index experienced severe increases of more than 50% during the 2008 Financial Crisis.
This means that, on average, options traders anticipated that stock values would change significantly over the course of the following year, up or down by 50% of the time. The index rose as high as 85% at one point during the crisis.
Investors frequently use options to hedge their positions when they expect significant upswings or downswings in stock prices. Owners of call or put options will only sell them if a sizable premium is paid in exchange.
It will rise as option prices generally climb, signaling increased market uncertainty and higher expected volatility. This will inform investors of the likelihood of rising market volatility.
The S&P 500 Index's future volatility and option pricing are thought to be accurately reflected by the volatility index.
How to anticipate future volatility
Though it doesn't do so perfectly, the index makes an attempt to gauge future volatility over the next 30 days. A reading of 25 does not necessarily indicate that volatility will be, on average, 25% during the next few weeks.
In fact, research on the index has revealed that it typically overestimates volatility by 4% to 5%. However, the studies also demonstrate that the volatility index has some predictive validity.
Here are some easy rules for interpreting what the volatility level indicates about upcoming volatility:
-
Between 0 and 12: Low volatility is anticipated when the values are at this level. To put things in perspective, the VIX's lowest daily closing reading was 9.14 in November 2017.
-
Between 13–19: This range is regarded as typical, and regular volatility during the ensuing 30 days would be anticipated when the value is in this range.
-
20 or higher: It indicates that there will be more volatility during the upcoming 30 days. This level is typically reached when there is market stress, such as when there are concerns about an economic downturn or recession. During significant market occurrences like the financial crisis or the onset of a pandemic, the volatility may reach levels of 50 or higher.
Keep in mind that these are merely sweeping suggestions. Unexpected events have the potential to destabilize markets, and if the environment changes, today's low volatility values might be followed by a period of exceptionally high volatility.

Researched and authorized by Marazban Tavadia | LinkedIn
Reviewed and edited by James Fazeli-Sinaki | LinkedIn
Free Resources
To continue learning and advancing your career, check out these additional helpful WSO resources:
- Call Option
- Dow Jones Industrial Average (DJIA)
- How to Invest in the S&P 500 Index
- Short-Term Investments
- Value at Risk (VaR)


or Want to Sign up with your social account?