How the 3 Financial Statements are Linked
The three financial statements are the Income Statement, Balance Sheet, and Cash Flow Statement, which show profitability, financial position, and cash movements.


How are the 3 financial statements linked?
The three financial statements are the Income Statement, Balance Sheet, and Cash Flow Statement, which show profitability, financial position, and cash movements.
These statements are pertinent to financial analysis, and understanding how they are linked is a crucial step toward gaining a comprehensive understanding of them.
The income statement can be viewed as a starting point, with net income running through to both the balance sheet and the statement of cash flows.
However, this is an oversimplification as each statement will be unique. Different companies also include different information on the face of their statements, further complicating the relationships.
Memorizing the links is not necessary; understanding how the statements are connected is key..
Rather, once you understand how the statements are connected, you can easily figure out the links on your own. This will help when a company reports items differently from what you are used to.
- The 3 financial statements (income statement, balance sheet, and statement of cash flows) are highly interconnected, and company activities often impact all 3 statements.
- There are key links that are actively visible, such as ending cash from the cash flow statement equalling the cash balance in the balance sheet, and some less visible links, such as the assumption of new debt increasing the interest charge in the income statement.
- Financial ratios can be derived by combining information from different financial statements, illustrating the company's financial health.
Understanding the three financial statements
The 3 financial statements are:
1. Income statement (IS)
- Runs from total revenues down to net income
- Separates the expenses that the company incurred to generate revenue
- Illustrates the profitability of a company and makes any expenses that are eating into profits the most
2. Balance sheet
- Characterized by the balance sheet equation:
Assets = Equity + Liabilities
- Measures the total value of assets under the control of the business and also identifies how those assets have been bought (either through equity ownership or through debt/liabilities)
3. Statement of cash flows (SCF)
- Generating cash is a crucial overarching goal for all companies
- Some profitable companies struggle to generate cash and end up failing due to poor cash management
- The SCF allows the stakeholders of a company to analyze where cash is coming from and, perhaps more crucially, what it is being burned by
- There are 3 sections to the SCF: cash flows from operations, cash flows from investing activities, and cash flows from financing activities.
Net Income & Retained Earnings
As mentioned earlier, net income is the most apparent link between the 3. Net income is the final line item on the IS. It flows through to the balance sheet in retained earnings.
The formula to calculate retained earnings is:
Retained Earnings = Retained Earnings (previous period) + Net Income
Retained earnings are listed in the equity section of the balance sheet, so it makes sense that the revenue remaining after all prior claims should be attributed to the company's owners.
Net income also impacts the SCF, as it is the starting point for calculating cash flows from operations. Again, this is a logical connection as the company generating more profits will increase the cash available.
PP&E, Depreciation, and Capex
Depreciation is an expense that spreads the cost of a long-term asset over its useful life (the amount of time you expect to use the asset).
For example, if you buy a factory for 10,000 USD and expect to use it for 10 years, you would depreciate it over the 10 years at 1,000 USD per year.
Depreciation impacts all financial statements. On the balance sheet, the value of the non-current asset will decrease by the amount of the depreciation (1,000 USD in the example).
In the income statement, depreciation is a pre-tax expense. Therefore, if we assume taxes are 40%, the profit before tax would decrease by 1,000 USD; however, this would only result in a 600 USD decrease in net income due to the tax shield provided by depreciation.
As mentioned above, this net income will be directly allocated to retained earnings in the balance sheet.
Additionally, as mentioned earlier, we understand that net income affects the SCF. Operating income will decrease by 600 USD. However, because depreciation is a non-cash expense, we deduct depreciation, resulting in an overall decrease in cash of 400 USD.
To illustrate this example, here are some made-up financial statements:
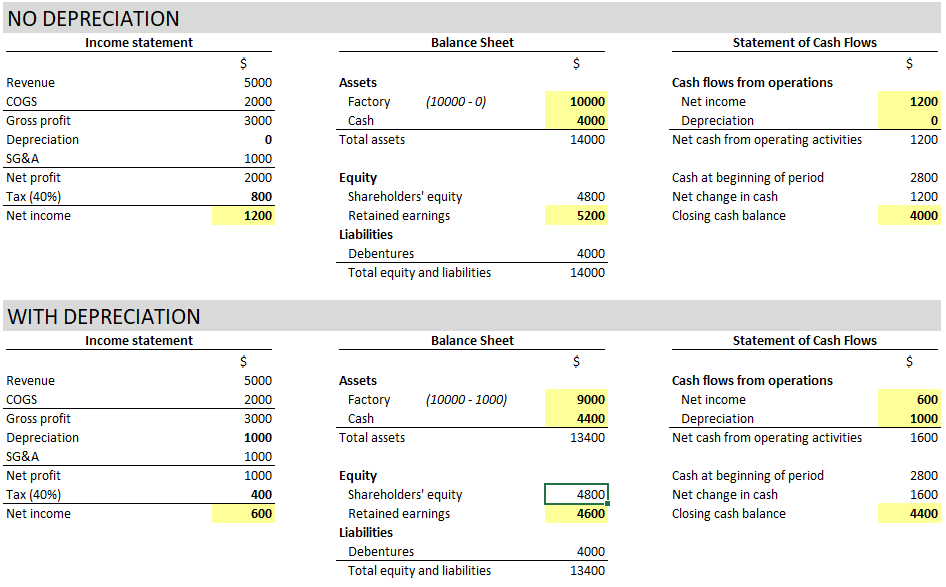
This hypothetical scenario provides insight into what a $1,000 increase in depreciation would look like on the three financial statements. It is the same scenario as described above.
Ratios and metrics derived from interconnected data
The interconnected nature of the financial statements enables the calculation of ratios that provide further insight into a company’s financial health. When analyzing a set of financial statements, some important ratios to calculate are:
- Return on assets (ROA): Measures how effectively a company’s assets are at generating income. Draws from the income statement (net income) and the balance sheet (average total assets)
Net income / average total assets
- Return on equity (ROE): Measures how well a company can generate profit for its shareholders. Draws from the income statement and the balance sheet
Net income / average shareholders’ equity
- Asset turnover ratio: Measures how effectively a company can generate sales from its assets. Draws from the income statement and the balance sheet
Revenue / average total assets
- Interest coverage ratio: Measures the ability of a company to service its debts. Draws from the income statement and interest expense information
EBIT / interest expense
- Free cash flow to equity: Measures the cash available to equity holders after expenses, reinvestment, and debt are paid. Draws from the cash flow statement and from the balance sheet
Operating cash flow - capital expenditure - change in net working capital
Financing Activities Impact on the Financial Statements
Companies often raise finance through either a stock offering or issuing debt. Both methods of raising finance impact all 3 financial statements. Let’s see how it can impact the financial statements below:
Income statement
The income statement will show the least difference of all 3 statements. If we consider a debt offering, there will be an increase in the interest expense that the company must pay due to taking on more debt.
However, this will not take effect until the first interest payment on the debt is made.
For an equity offering, there will be no direct difference to the income statement. It is possible (but not necessary) that dividend expenses increase with more equity being issued, thereby decreasing the net income that is distributed to retained earnings.
Cash flow statement
The cash flow statement will undergo a significantly more substantial change. In both debt and equity offerings, cash flows from financing will increase dramatically to reflect the cash inflow from the financing activities.
Assuming no other changes, the other sections of the cash flow statement will remain the same, resulting in an overall increase in total cash inflow for the period due to the financing.
Balance sheet
As we have seen from the cash flow statement, the company's cash balance will increase by the amount of financing activities. However, as per our balance sheet equation, the balance sheet no longer balances.
The increase in cash needs to be met by an equal increase in either equity or liabilities.
This increase will be by placing the new financing itself on the balance sheet, i.e., including the new debt in long-term liabilities or the new shares offered in share capital and share premium. This should result in the balance sheet staying in balance.
Conclusion
Financial statements can appear a jumbled mess at first sight, but once you start understanding how they interact, they begin to appear coordinated.
New transactions often result in changes to all the statements, if not directly, then indirectly over time. Therefore, understanding the mechanisms behind these interconnections is a great starting point to underpin any financial analysis.
The income statement, balance sheet, and cash flow statement are tightly connected and together provide a complete view of a company’s financial position.
Net income links all three—it’s the bottom line of the income statement, flows into retained earnings on the balance sheet, and is the starting point for cash from operations in the cash flow statement.
Other elements, such as depreciation and financing through debt and equity, also appear across all three. Instead of memorizing these links, it’s more useful to understand the logic behind them. This way, you can interpret any company’s statements, no matter how they’re presented.
3 Financial Statements Linked FAQs
There are numerous links between the statements, but the most notable links you need to be aware of are:
- The net income (income statement) is linked to retained earnings (balance sheet)
- The impacts of depreciation (and the resulting tax effects) on all 3 financial statements
- The direct link between cash at the end of the period (cash flow statement) and the cash on hand balance (balance sheet).
The income statement is directly linked to the balance sheet, as net income is transferred into retained earnings in shareholders’ equity.
Retained Earnings = Retained Earnings (previous period) + Net Income
The first line in the cash flow statement is often operating income.
This comes directly from net income in the income statement and is then reconciled to get the cash flows from operations (the income statement includes non-cash items such as depreciation, which must be removed).
The final balance in the cash flow statement, cash at the end of the year, is equal to the cash balance entry in the balance sheet.
Since the change in cash for the period is determined, in part, by net income from the income statement, it becomes clear how the 3 statements can all impact each other.


Free Resources
To continue learning and advancing your career, check out these additional helpful WSO resources:


or Want to Sign up with your social account?