L-Shaped Recovery
A type of recovery where the economy of a nation experiences an elongated period of decline or stagnation after a quick and sustained recovery.


What Is An L-Shaped Recovery?
The L-shaped recovery is one of the types of recovery where the economy of a nation experiences an elongated period of decline or stagnation after a quick and sustained recovery.
Economies that tend to blow down into recession are seen to recover back in specific patterns. Such patterns can be graphed and match some English letter shapes.
One such recovery path can be traced through the letter L. The graph of an economy where recession results from a steep fall and recovery is shallow.
A steep fall and when recovery is not at the same rate of fall or even pushes the economy back to pre-recession levels, it perceives the L-shaped recovery.
The point to be noted is that L-shaped recovery is the worst possible form since it takes a long time to fix the economy.
That means until a shallow recovery returns to pre-levels, a long time, till then the economy follows a massive recession.
It lies in bottom growth rates, massive unemployment, and inflation is one factor that takes a toll in a recession.
Such recoveries can also be associated with the term economic depression. Economic depression is a recession that stagnates in the economy for extended periods, and no signs of recovery are seen.
In L shape of recovery, the economy grows almost zero or negligible. A situation where nothing works, just still and stagnant.
It might take years to compensate for the recession losses and even years to return to full employment.
The indicators that reflect economic growth are suggested to be plotted, and one will probably show the characteristics of the L shape. The economic indicators taken into observation are Gross domestic product, unemployment, industrial output, and income growth.
- A steep fall and when recovery is not at the same rate of fall or even pushes the economy back to pre-recession levels, it perceives the L-shape recovery.
- The point is that L-shape recovery is the worst possible form since it takes a long time to fix the economy.
- L-shaped recoveries are characterized by persistent unemployment, a slow return of businesses' investment activity, and a sluggish economic output growth rate.
- The L-shaped recession economy never returns to the pre-recession period, and the growth rate does not show much variation in quick response.
- Recessions can be changed into depressions if an economic crisis follows an L-shaped graph.
- In L shape of recovery, the economy grows almost zero or negligible. A situation where nothing works, just still and stagnant.
- It might take years to compensate for the recession losses and even years to return to full employment.
Comparing L-shape recovery
Apart from L-shaped recovery, there are other patterns of recovery as well that resemble a letter. Moreover, have different characteristics and growth patterns as well.
Other shapes like W, U, and V are recovery processes relatively faster than the L shape of the recovery.
The prime concern is that when the economy is in a prolonged recession phase, its past collected resources rain, present resource creation does not take place, and future creation takes much longer to stabilize after recovery.
The more the economy has a recession or depression phase, the more the pressure of economic burden will fall on the population to survive.
Businesses shut down due to survival of the fittest, and widespread unemployment is the biggest issue of all time in the recession phase.
All economies do not work near their full employment level; therefore, the potential is underutilized.
L-shaped recoveries are characterized by persistently high unemployment, a slow return of businesses' investment activity, and a sluggish growth rate in economic output and are associated with some of the worst economic episodes in history.
The problem is that once the economy gets into recession, it does not adjust itself or reallocate resources faster to get workers working or revive the business's growth rate.
Repercussions are quite severe. Workers not getting jobs remain unemployed for long periods or maybe years; no new job creation takes place, and they might have to leave the workforce.
Since businesses find no returns or negligible returns, they do not wish to invest or produce, which means no new capital is engaged. Even old capital like machinery and equipment or maybe factories seems to be wasted without utilization.
Different economic schools of thought are argued upon the stance on L-shaped recovery. For example, Keynesian economists often argue that the reason behind such a recovery shape is consistent pessimism and underconsumption.
Not only that, but excessive savings by the population in expectation of worse conditions can produce a more extended period of sub-normal economic activity.
Even if economists believe it would be a regular activity, there is no reason to expect a rapid economic adjustment to rebound.
Another school of thought relies upon that any fiscal or monetary intervention to boost the recovery leads to more losses.
Recovery of an economy
It might seem that a monetary or fiscal policy will make a recovery faster, and the economy will adjust. Still, it creates more obstruction since responses depend on multipliers that tend to behave differently during the recession.
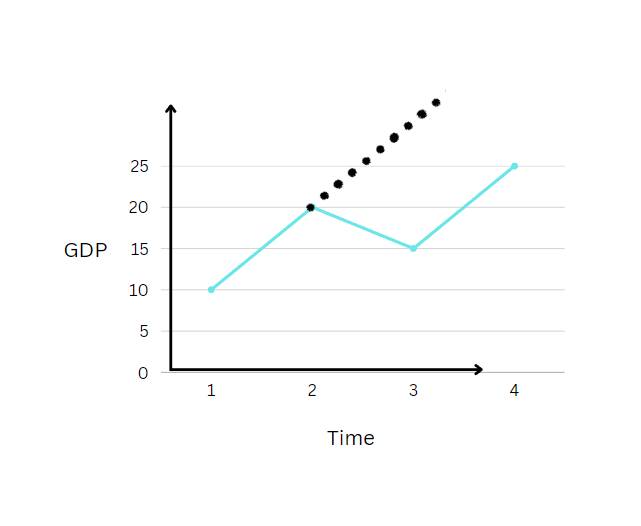
The graph shows what L shape recovery looks like. First, the economy falls steeply until it reaches the extensive bottom. It can be observed that the fall happens very rapidly, but also we can see that the bottom is just a point and not a stagnant area.
This implies that the extreme bottom point starts recovering and not staying at the same point quickly. However, on the other hand, the recovery line is flatter; this means that recovery from the lowest bottom takes place in less time, but the path of recovery is slowest.
Moreover, it can be seen that the recovery line never touches the pre-recession peak but instead goes parallel to it.
It might reach pre-recession points, but that will take enormous time. Therefore, the shape seems to be a diagonal L. For obvious reasons discussed above, the economy never bounds to recover fully; therefore, it is termed a depression rather than a recession.
Moreover, if you observe the x-axis variable, time, the start is visible, but the end is not given. This implies that there will be no estimated time when the economy can be said to be recovered.
Therefore disaster can be a depression that follows an L-shaped recovery.
V-shaped recovery Vs. L-shaped recovery
V-shaped recovery is the fastest path of recession recovery, whereas L shape is the slowest path.
A V-shaped recovery is when there is a short trough after a period of economic decline, further followed by a rapid recovery.
The losses and repercussions of v-shape recovery are not that severe relative to L-shape recovery since L-shape recession persists for a long time.
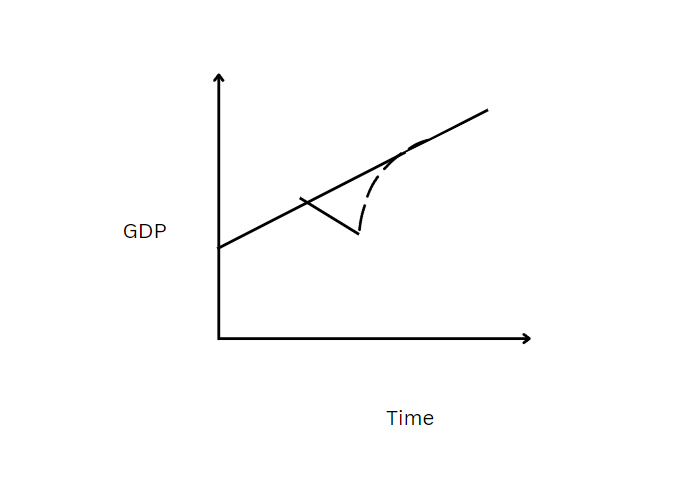
Both the shapes follow a steep decline in GDP and touch the bottom at a point for a short time. However, a significant difference occurs after that.
Once the economy starts to rebound from the lowest point, a V-shaped recession's recovery line is much steeper than an L-shaped recession.
This implies rebound of the economy will happen much faster in V-shape recovery. I also observe that the economy returns to the pre-recession peak in V-shape recovery and then grows at further rates.
However, in L shape recession economy never returns to the pre-recession period, and the growth rate also does not show much variation in quick response.
To understand these differences, we can look at Figure 1 and then compare it with Figure 2 below.
Real-life pieces of evidence of L-shaped recovery
It is not only a theoretical observation; yes, world history has seen much evidence to prove the causes and repercussions of L-shaped recovery.
Some of the significant events that occurred are mentioned below.
Lost Decade - Japanese Story of Recession
Japan followed a remarkable growth from the 1980s to the 1990s. Japan's economic growth was ranked top on the list in the gross domestic product in the 1980s. Stock market prices and real estate performance were sharply rising.
The economic phenomenon is that once assets imbibe a peak, they fall abruptly as the asset price bubble bursts.
To prevent it, the bank of Japan raised interest rates. However, this proved to be a disaster. A recession followed in Japan.
The stock markets crashed, and GDP fell from 4% to nearly 1% from 1991 to 2003.
To further use policy tools, the Japanese government took ten rounds of fiscal deficit spending accompanied by economic stimulus totaling 100 trillion yen in a decade.
Monetary policy was also regulated to curb the crisis. The interest rate was reduced continuously; the consequence was that the interest rate reached nearly 0% in 1999.
This further created the need for a new supply of reserves in the banking system. The growth did happen after the GDP was lowest, but the growth rate did not accelerate much for ten years.
This followed an L-shaped recovery path. The growth rate followed a low pace for another decade, meaning that initial pre-recession points were achieved only after a prolonged slow pace.
The Great Depression
The U.S. is one such economy of significant historical economic events. For example, in 1929, it experienced a significant stock market crash.
This crash followed a prolonged depression that took over a decade to work better. The GDP has fallen sharply since the recording, with the highest unemployment at 25%.
The stagnation and unemployment persisted for ten straight years until the economy rebounded. The worst decision regarding fiscal policy worsened the depression.
President Hoover increased taxes and government spending to have an accommodative policy. This resulted in high-time increased Fed deficits to 4.5% of GDP.
Also, Hoover led a concerted federal campaign to keep wages and prices from falling through new federal lending subsidies, labor legislation, federal funding for unemployment benefits, and influential, though not technically enforceable, demands that businesses not cut workers' pay.
The recession continued to deepen following these measures. This was followed by a more monetary intervention that further led to disaster.
Monetary expansion was done by reducing discount rates, and the Fed bought many treasury securities to inject liquidity into the system.
After this president, Franklin D. Roosevelt also radically used the same measures. As a result, they further led to high unemployment and low GDP for a very long time.
L-Shaped Recovery And The Great Recession
As discussed earlier, the U.S. has an extensive boom history of economic recessions. One such recession that was a hyper-chronic situation was the great recession.
The period started with the financial crisis of 2008 when the capital market dried up. As a result, the U.S. housing bubble burst, and real estate fell drastically.
Credit creation worsened, and business-faulted loans created havoc. Stock markets reflected this turmoil, and unemployment peaked at 10% per annum.
The government again worsened the situation by using its policies.
The Bush administration enacted a $700 billion taxpayer-funded bailout of the financial sector in the form of the Troubled Asset Relief Program.
Monetary expansion was undertaken on a massive base. The Fed initiated new lending facilities and quantitative easing.
They injected around $4.5 trillion in bank reserves into the economic system. As a result, it increased liquidity and therefore lowered rates.
After these massive campaigns of monetary expansion and deficit spending, the U.S. economy experienced the slowest recovery of the post-World War two eras.
The average GDP growth remained around 2.5% for a long time, and unemployment remained stagnant at 5% until the new high-range business cycle in 2016.
We have observed how an L-shaped recovery can be fatal to an economy.
Additionally, it takes much time to revive the economy; therefore, economists do not advocate an L-shaped recovery for any recession.
Recessions can be changed into depressions if an economic crisis follows L shaped graph.
We have seen how the U.S. economy has relied on L-sap recovery twice and has felt the repercussions for so long.
Japan is on top of its growth trajectory, which fell dramatically due to this recession in an L-shaped recovery path.
Moreover, the first and foremost important thing to notice is that both countries chose policy measures to boost recovery, but these policies proved to be more oil to the burning flame.
Therefore economies should create edging and hedges around the financial aspects before a recession.
When working on policies, it is important to decide the radicalness of the functions and the timeline to which they will show results in favor of the goal.

Free Resources
To continue learning and advancing your career, check out these additional helpful WSO resources:


or Want to Sign up with your social account?