Efficiency Ratios
The measure of the company’s ability to deploy its resources to generate revenue effectively


What are Efficiency Ratios?
Efficiency ratios are a measure of the company’s ability to deploy its resources to generate revenue effectively.
In simpler terms, the ratio measures the ease at which the company can convert the inputs to outputs. It can also be called the operating efficiency or activity ratios.
The resources and inputs mentioned in the definition include the company’s assets, capital, and liabilities. The output, in this case, is the cash that could be generated, increased customer base, etc.
The information required to compute ratios is extracted from the income statement and the balance sheet.
Efficiency ratios are a type of accounting ratio used to conduct financial statement analysis. Other accounting ratios include liquidity, profitability, and solvency.
-
The liquidity ratio is the ability of the company to meet its short-term obligations, like timely payment to debtors.
-
The profitability ratio measures the earning capacity of the company from its operations.
-
The solvency ratio determines whether a company can meet its long-term obligations, like its commitment to shareholders.
Apart from the basic formula for the efficiency ratios, there are several others. The most important include the asset turnover ratio, inventory turnover ratio, and accounts receivable and payable turnover ratio. These categories of ratios have been discussed later in the article.
- These ratios measure how well a company uses its resources to generate revenue. They reflect the ease of converting inputs to outputs and include turnover and day ratios.
- Efficiency ratios help gauge a company's operational efficiency. They're vital for assessing financial health, improving operations, and attracting investors or creditors.
- Comparing ratios against industry benchmarks or competitors is crucial for meaningful analysis. It reveals areas needing improvement or potential risks.
- Asset Turnover, Inventory Turnover, and Accounts Receivable/Payable Turnover are crucial efficiency ratios. They reflect sales generation from assets, inventory management, and handling of payables and receivables.
What Does an Efficiency Ratio Tell You?
The firm's financial performance can be evaluated using this tool. The firm can understand how effectively and efficiently they have used its resources, particularly non-cash assets, to generate cash.
When managed correctly, managers can increase the company’s sales and profitability.
Ratios are a key metric used to evaluate any financial decision. A company’s financial health and performance can be interpreted using ratios. Prospective investors and creditors also compute this ratio to tally the company's operational health.
A company might appear to be operating effectively on the surface, but its ratios might indicate otherwise. The company could also find the areas that require improvement or are most exposed to a business or financial risk.
Interpreting the ratios independently provides little information. It must always be compared to a particular benchmark or standard.
A company could analyze and compare its performance through the ratios calculated for a short period or a financial year. An internal comparison enhances decision-making for the managers.
Note
The benchmark for comparison can be the previous year's financial performance.
Performing a competitor analysis using the ratios is also possible and encouraged. However, selecting a competitor in the same industry with a similar market size is essential for accurate comparison. An appropriate benchmark is to compare your company’s performance to the industry leader.
Most importantly, profitability can be increased by controlling and improving the company's operations. An increasing profit is always in the company's best interest and the shareholders' as well.
By appropriately interpreting the ratios, companies could increase the shareholders' wealth - the common motive for all firms.
Efficiency Ratio Formula
The most basic efficiency ratio compares the expenses with their related revenue.
To calculate, we’ll use the below formula:
Efficiency Ratio = Non-Interest Expenses / Revenue
In the banking industry, this formula is commonly used to calculate the proportion of overhead expenses to revenue. The primary users of this ratio are bankers and analysts. Bank managers assess the performance of their bank.
Interest payments from loan borrowers account for most of the revenue for banks. In comparison, a typical bank expense account includes general day-to-day expenses like administrative expenses, salaries, and rent.
The ratio compares how much of the revenue is contributed to non-interest expenses. Thus, a lower ratio is always preferable. It is said to have a ratio below 50%.
Let us assume there is an increase in the ratio. This would indicate that the bank managers have not been able to manage their expenses well. So now more revenue would be used up to reimburse their expenses.
Let us assume that Bank A incurred non-interest expenses worth $50,000 in 2022 and $60,000 in 2021. Additionally, the revenue is $150,000 for 2022, and for 2021 it is $250,000. To compute the ratio, we simply divide the expenses by the revenue.
Efficiency Ratio - 2022 = (50,000/150,000) = 33%
Efficiency Ratio - 2021 = (60,000/250,000) = 24%
There is an increase in the ratio, which indicates a drop in efficiency. Although the banks' expenses have decreased by $10,000, the revenue has significantly declined by $100,000.
Examples of Efficiency Ratios
Financial analysts evaluate a company’s operational performance using different efficiency ratios. For better understanding, let us separate the ratios into categories based on their unit of measure.
Firstly, turnover ratios are expressed in times. Turnover measures the swiftness with which an input can be converted to an output. Turnover ratios include the following:
- Asset Turnover Ratio
- Inventory Turnover Ratio
- Accounts Receivable Turnover Ratio
- Accounts Payable Turnover Ratio
Secondly, day ratios are expressed in days. These ratios measure the days the company would require to convert an input to an output. The day ratios include the following:
- Day Sales in Inventory (DSI)
- Average Collection Period (ACP)
- Average Payment Period (APP)
- Cash Collection Cycle (CCC)
The ratios below will be calculated using information sourced from Apple’s 2022 financial report. For previous financial reports of Apple, click here.
Below is the consolidated financial statement of Apple for the year ended 2022.
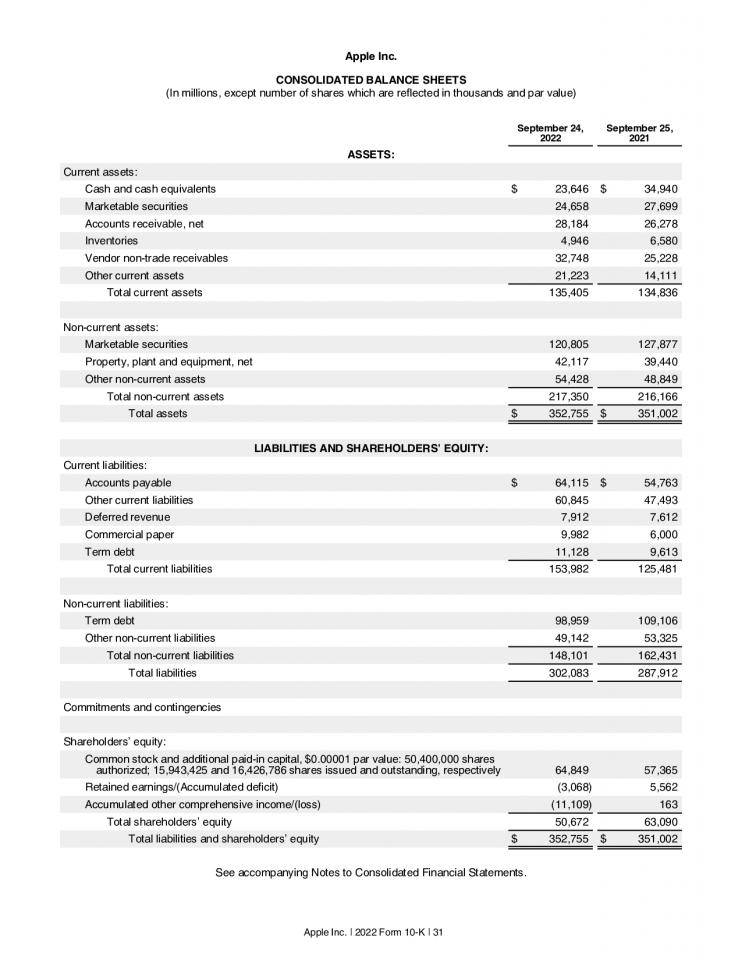
Source: Apple
Below is the consolidated Income Statement of Apple for the year ended 2022.
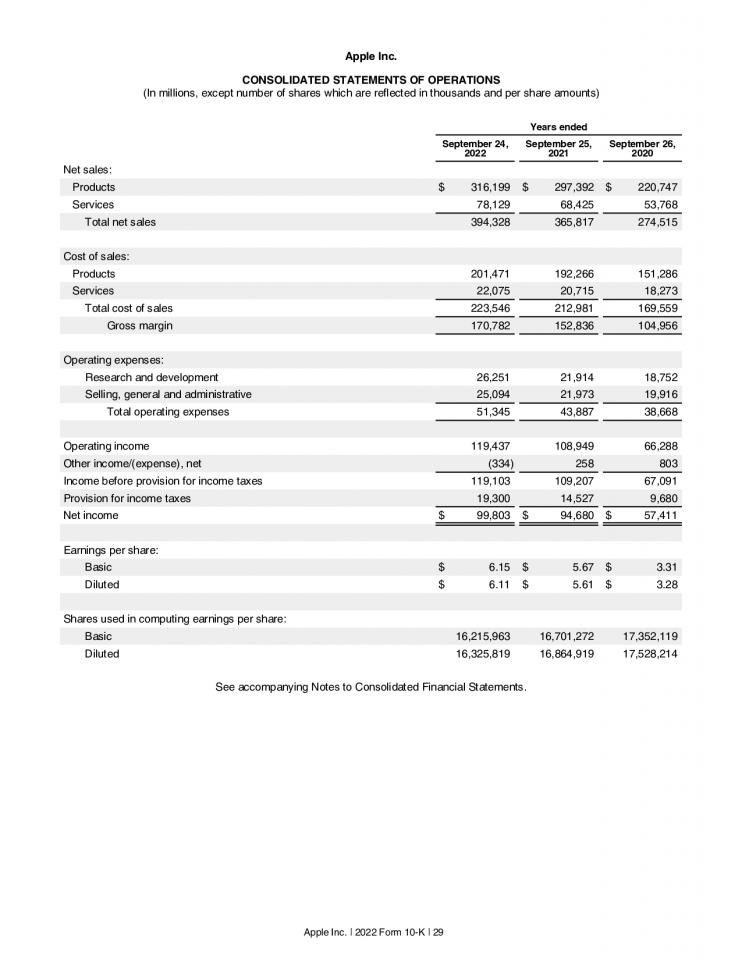
Source: Apple
Asset Turnover Ratio for measuring efficiency
The Asset Turnover Ratio measures the ability of the company to utilize its assets to generate sales. The ratio is usually measured on yearly amounts and is not meant for short-term comparisons.
To calculate, we use
Asset Turnover Ratio = Net Sales / Average Total Assets
Net sales is the income rendered from the products and services the company sells during a fiscal year, less any discounts or deductions.
Average total assets is the amount calculated when the total assets of the current and the previous year are halved. One can also use the current period values for yearly comparisons.
Sales are expressed as a percentage of the total assets. Thus, a higher ratio is advantageous as it would indicate that the assets are being deployed efficiently for sales. A lower ratio is a negative indicator of efficiency.
Let us now calculate the ratio for Apple using the sales from the income statement and the assets from the balance sheet.
Average Total Assets - Apple = (352,755 + 351,002) / 2 = $351,878.5
Asset Turnover Ratio - Apple = 394,328 / 351,878.5 = 1.12 times
We can infer that $1.12 of sales is generated with every dollar of asset.
Inventory Turnover Ratio for measuring efficiency
The Inventory Turnover Ratio measures the company’s ability to generate sales from its existing inventory. It measures the times that the sales could turn over the inventory.
The formula to calculate is
Inventory Turnover Ratio = Cost of Goods Sold (COGS) / Average Inventory
As the name suggests, the cost of goods sold is the expense incurred when a company attempts to sell its goods. It includes expenses for raw materials and labor, apart from other overhead costs. Therefore, the COGS is considered an expense found in the income statement.
Inventory is the goods or materials for sale or used in a business. Average inventory is calculated similarly to the average total assets. It is the previous and current year's inventory balance average. The inventory amount is found in the balance sheet.
The ratio indicates the management's efficiency in administrating the inventory. Thus, a higher ratio would signify that the inventory is managed effectively and efficiently.
Note
The company with a higher ratio would hold lower inventory levels owing to rapid sales.
A lower ratio is a negative indicator of the company's sales, as it would mean they cannot use up their inventory. The inventory would be obsolete or idle and persist with a high balance.
The optimal ratio varies across industries and is specific to the type of goods the company specializes in. For example, a jewelry company would have a lower inventory ratio as its goods are considered a luxury.
On the other hand, a company selling essential items like supermarkets would have a higher inventory turnover ratio.
Let us now calculate the ratio for Apple. All values below are expressed in millions.
Average Inventory - Apple = (4,946 + 6,580) / 2 = $5,763
Inventory Turnover Ratio - Apple = 223,546 / 5,763 = 38.79 times
Day Sales in Inventory (DSI) for measuring efficiency
The DSI measures the number of days it takes for a company to complete a sale with the delivery of inventory. It is related to the inventory turnover ratio. This measures the efficiency with which the inventory is managed and its related sales.
The formula is
DSI = 365 / Inventory Turnover Ratio
The DSI also indicates the number of days the company can expect to receive cash after the sale of the inventory item.
For example, a company has a DSI of 20 days. They can expect their inventory to be sold within the next 20 days and to receive payment for it.
When the inventory turnover ratio decreases, the DSI will increase. Therefore, it is optimal to keep the DSI lower as it would indicate a good turnover for the inventory, and sales are completed efficiently.
A higher DSI would indicate that the company is having a decline in sales or that the inventory turnover is slow.
The DSI for Apple will be calculated as follows:
DSI - Apple = 365 / 38.79 Times = 9.41 Days
Accounts Receivable Turnover Ratio for measuring efficiency
The Accounts Receivable Turnover Ratio measures the company's ability to manage its receivables balances effectively. It measures the effectiveness of the company collecting its debts, and the balance is converted to cash.
For calculation, we’ll use this formula.
Accounts Receivable Turnover Ratio = Net Credit Sales / Average Accounts Receivable
Credit sales are the portion of the total sales extended by credit. It has a post-payment policy. For example, a car's sale is initiated and extended by credit. This means that the payment would be received after the sale has been completed.
Sometimes the amount of credit sales is directly given in the income statement. Other times the proportion of credit to cash sales is mentioned in the notes to financial statements.
Average accounts receivable is the current and previous years' balance average. The accounts receivable balance is found in the balance sheet under Current Assets.
Note
It is preferable to maintain a higher ratio as it would indicate that the collection of accounts receivable is timely.
Conversely, a lower ratio is substandard as it indicates that the receivables are collected slower. This could be due to an inadequate credit policy or the debtors' financial instability.
Let us calculate the ratio for Apple. No information is provided in the financial statements for the percentage of credit sales from the total sales. Let us assume that 25% of the sales were given on credit. All values are expressed in millions.
Net Credit Sales = 394,328 * 25% = $98,582
Average Accounts Receivable = (28,184 + 26,278) / 2 = $27,231
Accounts Receivable Turnover Ratio - Apple = 98,582 / 27,231 = 3.62 times
Average Collection Period (ACP) for measuring efficiency
The Average collection period, as the name implies, measures the number of days it takes for the cash to be received from a debtor. The ratio indicates the effectiveness with which the Accounts receivable balance is managed.
The formula for ACP is:
ACP = 365 / Accounts Receivable Turnover
The ACP impacts three primary business areas:
- the amount of cash the company has for its short-term obligations,
- the credit terms mentioned within the invoices, and
- the overall Accounts Receivable balances.
A lower number of days would suggest that the company has improved its debtor collections and can easily convert its receivables into cash. It could also mean the companies’ debtors are credit-worthy, and payments are not delayed.
On the other hand, a higher ratio indicates problems with debt collection. The company could also have a lenient credit term. Before reaching any conclusion, the company's credit terms must be reviewed.
The average collection period for Apple is:
ACP - Apple = 365 / 3.62 times = 100.83 days
Accounts Payable Turnover Ratio for measuring efficiency
The accounts payable turnover ratio measures the ability of the company to pay back its creditors. It measures the efficiency at which the vendor or supplier payments have been satisfied.
To calculate, we’ll use
Accounts Payable Turnover Ratio = Net Credit Purchases / Average Accounts Payable
Net credit purchases are the proportion of the purchases that credit has taken. Suppliers provide discounts for quicker payments. For example, a supplier provides a 2/10 credit term. This indicates the company would gain a 2% discount if full payment is completed within ten days. There would be no discount provided after ten days.
Net credit purchases are generally calculated by deducting the cash purchases from the total purchases. However, purchases are not usually mentioned in the financial statements. In that case, the below formula could be utilized.
Net Credit Purchases = COGS + Ending Inventory - Beginning Inventory
Average accounts payable is the average of the current and previous accounts payable balance. The balances can be found in the balance sheet under Current Liabilities.
A higher ratio indicates the company can satisfy its liabilities on time and redeem discounts. In contrast, a lower ratio would indicate that the company does not pay its suppliers on time and is relinquishing any discounts.
Note
The optimal ratio would depend on the business line.
If a company pays its suppliers on time, it could indicate that it may not be managing its cash adequately. By paying the suppliers periodically, the company could manage its cash strategically.
The ratio calculations for Apple are below: (in millions)
Net Credit Purchases = 223,546 + 4,946 - 6,580 = $221,912
Average Accounts Payable = (64,115 + 54,763) / 2 = $59, 439
Accounts Payable Turnover Ratio - Apple = 221,912 / 59,439 = 3.73 times
Average Payment Period (APP) for measuring efficiency
The Average Payment Period measures the number of days a company takes to compensate a creditor. It is related to the accounts payable turnover, and the efficiency of the company's payment structure is deliberated. It can also be called Days’ Purchases in Accounts Payable.
The formula for APP is:
APP = 365 / Accounts Payable Turnover
The APP can also be used to judge the company’s creditworthiness. Creditworthiness evaluates a company's ability to repay its financial obligations. Investors, banks, and creditors widely use this information.
As mentioned, for accounts payable turnover, the optimal ratio depends on the business structure. Similarly, the average payment period also depends on the company. It can also be dependent on the supplier. Some suppliers prefer quicker payment periods, while some prefer extended ones.
The average payment period for Apple is:
Average Payment Period - Apple = 365 / 3.73 Times = 97.86 Days
Cash Conversion Cycle (CCC) for measuring efficiency
The CCC measures the number of days the company takes to collect cash from the sale of its inventories. The cycle begins with the acquisition of the inventories until the cash receipt from its sale.
We can calculate it using:
CCC = DSI + ACP - APP
CCC is a part of the operating cycle. The operating cycle is the time that the company takes between the acquisition of inventory and its sale. The CCC only measures the days when the company does not have cash.
Operating Cycle = DSI + ACP
This ratio combines the day ratios we calculated above. It measures the number of days before the inventory is sold, when the receivables would be satisfied, and when the payment to the suppliers is completed.
The Operating Cycle and CCC for Apple are:
Operating Cycle - Apple = 9.41 + 100.83 = 110.24 Days
CCC - Apple = 9.41 + 100.83 - 97.86 = 12.38 Days
The total number of days Apple takes from acquiring its inventory to finally completing a sale is 110 days. The 12 days are a part of the 110 days. During the 12 days, the payables stay outstanding.

Everything You Need To Master Financial Statement Modeling
To Help You Thrive in the Most Prestigious Jobs on Wall Street.


or Want to Sign up with your social account?