Canadian Equity Risk Premium
The excess return provided by investing in equities over a risk-free rate.


What is Equity Risk Premium?
The equity risk premium is the excess return provided by investing in equities over a risk-free rate. The variable is a primary key component of practically every risk-reward model used in finance.
The excess return that comes from investing in stocks over a risk-free rate is known as the equity risk premium.
Almost all risk-reward models used in finance today have this variable as a key component, but the method it is calculated might not be suitable for research that looks forward. The Canadian equities risk premium will be examined in this guide.
To estimate the components, we can deconstruct the equity risk premium, which is the expected return on the S&P/TSX Composite Index minus the expected return on a riskless bond.
In this article, we will understand how the Canadian equity risk premium works, the three main steps of calculating the risk premium, and what are the components of its equations.
- The Canadian Equity Risk Premium (ERP) is the extra return investors expect from Canadian equities compared to a risk-free rate, compensating for the higher risk associated with equity investments.
- The ERP is a key component in various financial models, such as the Capital Asset Pricing Model (CAPM), which is used to estimate the expected return on equity investments and to value companies and projects.
- Financial professionals use the Canadian ERP to create investment strategies, estimate future returns, and assess risk for client portfolios.
- The ERP is compared to the return on government bonds, reflecting the extra return demanded by investors to hold riskier assets like stocks instead of safer government securities.
Understanding Canadian Equity Risk Premium
The equity risk premium refers to the extra return provided by investing in the stock market over a risk-free rate. This excess return compensates investors for the higher risk associated with equities investing.
The size of the premium fluctuates and is determined by the level of risk in a certain portfolio. It also shifts over time as the market risk shifts. The reason behind determining ERP is purely theoretical because equity market performance cannot be determined for the future.
In addition, it requires historical rates of return to calculate an equity risk premium. Since stocks are considered high-risk investments in general, investing in the stock market has certain risks, but it also has the potential to yield substantial positive returns.
Usually, when investors participate in the stock market, they are typically compensated with increased premiums. An equities risk premium also includes the extra return the investor gets over a risk-free investment like a treasury bill (T-Bill) or a bond.
The ERP depends on many factors at any given time or for any given investor:
- On whether stocks are cheap or expensive today (relative to corporate earnings).
- The dividend that stocks yield.
- The difference between what investors paid for the stocks and their price today.
- On the inflation rate.
- On the current 10-year Treasury yield.
- The performance of one stock, 30 stocks, the entire equity universe, or some quantity in between.
The ERP varies over time and drops when stock prices rise because its future growth potential decreases and grows when stock prices fall when stocks are on sale.
ERP contracts when 10-year Treasury bond yields are high because it may obtain a decent return without taking any long-term risk, and it expands when the Federal Open Market Committee reduces the risk-free rate, which can drop the 10-year Treasury rate.
Most investors behave in this manner by not taking ERP for granted. While equities are risky in the short term, it is widely assumed that they would outperform risk-free investments such as government bonds in the long run.
Some investors have been proven to pay more for equities if they feel the Federal Reserve percentage will come to their rescue in case the stock prices rise too high (run out of ERP). When equities fall, the Fed lowers rates, which restores ERP by expanding it from the bottom.
Sometimes, bonds become less competitive, stimulating demand for stocks, driving up prices, and canceling out the new ERP. Also, the equity risk premium is used to allocate and define portfolio return expectations.
The expected return on a stock is also linked to the equity premium through capital asset pricing. A stock that is considered riskier than the broader market, measured by beta, should offer larger returns than the equity premium.
steps To calculate The Equity risk premium
As we know, the equity risk premium is a long-term estimate of how much risk-free debt instruments will outperform the stock market.
The following are the three steps to determining the risk premium:
- Estimate the expected stock return.
- Estimate the return on risk-free bonds.
- Subtract the difference to get the equity risk premium.
The most challenging step among these three steps is estimating future stock returns, and many reasons can be explained in this section. Furthermore, many investors, especially short-term traders, are waiting for price confirmation to predict what will happen next.
The future is uncertain, meaning no matter how good the investor’s analysis is, it is only as good as the current information. It is impossible to know what will happen tomorrow. If the analysis of future movement is equal, in this case, they expect a stock will rise based on a trend.
Another reason is we can not predict all contingencies because predicting can be dangerous, especially if assumptions are incorrect. For example, predicting that something will rise when prices are decreasing can be disastrous for a trader's finances.
Especially since we never know how the market will react to new information or news. Even positive news may not push prices significantly higher when prices are falling, and bad news may not have a long-term adverse effect on prices when prices are increasing.
In addition, predictions can be vague, meaning that predicting whether a stock will rise or fall is difficult, and investment decisions rarely contain a profit or stop-loss exit point.
Also, inexperienced traders estimate that their stock positions will rise. They expect that if they are correct, they will be able to exit near the top. As a result, whether the trade is profitable or not, all traders must have a strategy for entering and exiting a trade.
Estimate The Expected Return On Stocks
The expected return ER is the profit or loss that an investor expects from an investment that has a known historical rate of return (RoR). It's computed by multiplying possible outcomes by their probability of occurring and then adding the results together.
ER calculations are used in many business operations and financial theory models, such as the modern portfolio theory (MPT) and the Black-Scholes option pricing model.
For example, if an investment has a 50% probability of gaining 20% and a 50% chance of losing 10%, the expected return is 5% = (50 % X 20% + 50 % X -10% = 5%).
In addition, ER is a method for determining whether an investment will have a positive or negative average net result. The sum is determined as an investment's expected value EV based on its prospective returns in various scenarios, as shown by the formula:
Expected Return = Σ (Returni x Probabilityi)
Where: “i” indicates each known return and its probability
Usually, ER is calculated using past data and cannot be guaranteed in the future; however, it often provides reasonable expectations. As a result, the expected return figure can be thought of as a long-term weighted average of past/historical returns.
Two statistical measurements can be used to examine a portfolio's expected return and standard deviation. The expected return of a portfolio is the mean average of the portfolio's conceivable return distribution.
The standard deviation of a portfolio, on the other hand, is a proxy for the portfolio's risk because it quantifies how far the returns differ from its mean.
Furthermore, investors should consider the likelihood of the expected return on their investment. After all, several lotteries have a positive expected return even though the chances of achieving such a return are quite low.
Estimate The Return On Risk-Free Bonds
The risk-free rate of return is the theoretical return on a risk-free investment. Over a given time, the risk-free rate is the interest an investor would expect to receive zero risk from investment.
Usually, the risk-free rate can be calculated by subtracting the current inflation rate from the yield on a Treasury bond with the same maturity of the investment.
The reason why the risk-free rate is the minimum return an investor expects for any investment? This is because they will not accept extra risk unless the possible rate of return is larger than the risk-free rate.
The investor's home market must be considered when determining a proxy for the risk-free rate of return in a specific situation, and in that case, negative interest rates might complicate the issue.
However, there is no such thing as a risk-free rate because even the safest investments can carry some risk. Therefore, the interest rate on a three-month Treasury bill (T-bill) is frequently used as the risk-free rate for U.S.-based investors.
Lastly, is to subtract the difference to get the equity risk premium. By deducting the risk-free return from the expected asset return, the equity risk premium is determined as the difference between the estimated real return on stocks and the estimated real return on safe bonds.
The Canadian Equity Risk Premium Equations
The equity risk premium can be calculated in many different methods, but experts argue which is the best.
Starting with the first equation of the equity risk premium, the expected return on the S&P/TSX Composite Index minus the expected return on a riskless bond, we can deconstruct it as:
- E(rs) is the expected return on the S&P TSX Composite index
- E(rb) is the expected return on a 1-year Government of Canada bond
- Or any maturity equivalent to the forecast horizon suitable for the investment that needs to be evaluated.
The expected return on the S&P TSX composite index can be expressed using the following equation:
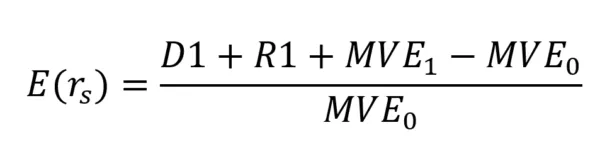
Where:
- D1 = Total Index dividends paid
- R1 = Total amount spent in the index on stock repurchases
- MVE0 = total market value of the index's equity at the beginning of the period
- MVE1 = total market value of the index's equity at the end of the period
We can also calculate R1 in case it is not given by R1 = Δ(S) * k
Where:
Δ(S) = S1 – S0
- K = price at which shares are repurchased
- S0 = number of shares outstanding at the start of the period
- S1 = number of shares outstanding at the start of the period
There is also another way to split down the expected return on the S&P/TSX Composite Index into two components by reorganizing the formula above and expanding the denominator:
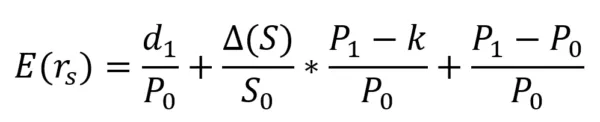
Normally, the TSX Composite's average total return can be used to proxy the health of the Canadian economy. If there is a decline in expected returns, we might conclude that the above-average returns in the Canadian equity market are becoming more challenging.
Since we have a background in analyzing the Canadian equity market, we also have to know that the Canadian dollar is closely associated with oil prices.
Furthermore, over the last ten years, the income ratio of Canadian households has risen from around 140 % to 175 %, which contributes to the overall pressure on the Canadian economy.
Furthermore, the following equation is also considered another formula where ERP can be calculated with expected growth, expected inflation, and bonds.
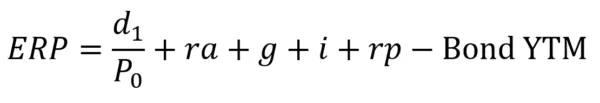
Where:
- g = expected real growth in earnings
- i = expected inflation
- rp = Re- pricing effect (p1/p0 -1)
The formula described above can be used to calculate the intrinsic equity risk premium for measuring expected equity returns against a risk-free rate for any major stock market index.
In the third equation of the equity risk premium, we can start with the capital asset pricing model CAPM, which is usually known as:
Ra = Rf + βa (Rm - Rf)
Where:
- Ra = expected return on investment in a or an equity investment of some kind
- Rf = risk-free rate of return
- βa = beta of a
- Rm = expected return of the market
We can say that Ra = Rm if we are talking about the stock market a = m. Also, the beta coefficient is considered a measure of the volatility or risk of a stock in that market. The volatility of the market is conventionally fixed to 1, so if a = m, then βa = βm = 1.
The market premium is known as Rm - Rf, and the risk premium is Ra - Rf. Also, In case we consider “a “as an equity investment. Then Ra - Rf is the equity risk premium. As a result, if a = m, then we can consider the market premium and the equity risk premium to be the same.
Certain markets in specific periods may exhibit a significant equity risk premium; some economists believe this is not a generalizable idea for all markets. They argue that a statistical peculiarity has seemed like an economic law due to a concentration on specific occurrences.
Some investors believe that the theory behind the equity risk premium does not account for all probable outcomes. The math is quite simple If you plug in historical rates of return and use them to estimate future rates.
There is one way to estimate long-term growth using dividends, which is based on a reworking of the Gordon Growth Model GGM:
k = D / P + g
Where:
- k = expected return expressed as a percentage (this could be calculated for Ra or Rm)
- D = dividends per share
- P = price per share
- g = annual growth in dividends expressed as a percentage
Another option is to use earnings growth rather than dividend growth. The earnings yield is equivalent to the expected return in the following model:
k = E / P
Where:
- k = expected return.
- E = trailing 12-month earnings per share (EPS).
- P = price per share.
Several stock exchanges have gone bankrupt over the years, so focusing on the historically outstanding Canadian market may be misleading; in this case, survivorship bias is the term for this type of bias.
In the end, the concept of an equity risk premium is valid, and ERP always requires historical rates of return, according to economists. Also, depends on some markets that encourage investors by giving rewards to them for taking on the higher risk of stock investing.


Free Resources
To continue learning and advancing your career, check out these additional helpful WSO resources:


or Want to Sign up with your social account?