GAUSS Function
It is a tool used in Excel that allows you to analyze data with ease


What is the Gauss Function in the Excel?
The Gauss function, also known as the normal distribution function in statistics, is a tool used in Excel that allows you to analyze data with ease. It's based on a bell curve that shows the distribution of data around the mean value. This provides valuable insights into the variability and probability of future events.
You can use the formula in a variety of fields. They range from finance and economics to science and engineering.
It is particularly valuable when it comes to analyzing data sets. Of course, if they exhibit a normal distribution. This is common in many real-world scenarios. It can help to perform linear regression analysis. Meaning it can assist with complex data analysis and simplify calculations.
Whether you're a student, a finance professional, or interested in the topic. This article will provide a comprehensive guide to the function formula. It outlines its uses, advantages, and flaws. So, let's dive in and explore the power of this formula.
- The Excel formula is useful for calculating the probability density of a given value in the normal distribution.
- The formula requires three inputs: X, Mean, and Standard Deviation.
- It is important to select the right input range, enter arguments correctly, and use the formula in the appropriate version of Excel (2010+).
- The formula returns a probability density that represents the likelihood of a given value occurring in the normal distribution.
- If you cannot find the formula in Excel, it might be because you don’t have the “Analysis ToolPak” add-in installed.
Understanding the Gauss Function in the Excel
The formula is a mathematical function. It calculates the probability density of a given data set. It’s named after the mathematician Carl Friedrich Gauss because he was one of the first to study it. It’s also known as the normal distribution function.
Application of the formula in Excel falls into a few topics, which are:
- Statistics and data analysis for data modeling
- Prediction forecasting
- Hypotheses testing
In short. It helps you simplify complex data analysis and thus shape it into an insightful picture. This helps you act with clearer decision-making.

When using the formula in Excel, one implements it using the NORMDIST function. This function takes into account four different arguments:
- The value you want to test
- Mean of distribution
- Standard deviation of distribution
- Logical value
The logical value determines if the function returns the cumulative distribution or the probability density.
With the basic understanding now acquired. It’s time to take a look at how to apply the function for accurate data modeling.
The history of the Gauss Function
The function is also known as the Gaussian function or the normal distribution function. It has a rich history and has played a vital role in the development of statistics and data analysis.
Carl Friedrich Gauss first introduced this function in the early 19th century. Why? To describe the probability distribution of a random variable. Since it has become a crucial tool for many applications.
Over time, the function has undergone refinement and improvement. Scientists and researchers have developed variations and adaptations to suit different applications. The function has particularly found wide use in the field of physics. Where it’s utilized to describe the behavior of particles and waves.
Despite the function's extensive application in physics and other fields. It nonetheless remains an essential tool for data analysts and researchers.
As computing technologies improve. So will the function's adaptability to new challenges and applications. This will enable it to stay a versatile and important tool for understanding data sets. Especially if they lean more toward the complex side.
In conclusion, Its history and development show the crucial role it has played and continues to play. Especially with its focus on contemporary science and mathematics. Its adaptability makes it an essential tool for contemporary data analysts and researchers.
How to apply the Gauss function in Excel and its alternatives?
It is very challenging to find appropriate functions to model large data sets. That is exactly when this function comes in handy, especially in Excel. It can help you create more accurate data models through its ability to fit in a very wide range of data at once.
To learn how to apply the Gauss function in Excel, follow these steps:
- Select the cell in your spreadsheet in which you want to place the Gauss function result.
- Type "=GAUSS(x,mean,standard_dev,[cumulative])" in the cell, where:
- x is the value you want to calculate.
- Mean is the average value.
- Standard_dev is the standard deviation.
- Cumulative is an optional argument. It determines whether to calculate the cumulative distribution.
- Replace x, mean, and standard_dev with the cell references of your data set.
- Press Enter, and the formula will calculate the value for you.
| Formula | Description | Example | Result |
|---|---|---|---|
| =GAUSS(x) | Probability that a member of a standard normal population will fall between the mean and 2 standard deviations from the mean | =GAUSS(2) | 0.477 |
Note
The formula assumes that data follows a normal distribution. Meaning, if your data set does not, the formula may provide inaccurate results.
Some alternatives for your particular situation would then be
a. LOGNORM.DIST
Calculates the cumulative distribution function (CDF) of a log-normal distribution. It is an often used distribution for modeling data skewed to the right (i.e., has a long tail on the positive side - Positively Skewed Distribution)
b. GAMMA.DIST
Calculates the CDF of a gamma distribution. It is another often-used distribution for modeling skewed data. You can use it to model data skewed to either left or right.
c. T.DIST
Calculates the CDF of a t-distribution. It is used in hypothesis testing and confidence interval estimation. It’s used when the sample size is small, and the population standard deviation is unknown.
Note
T.DIST is also useful for modeling data that is approximately normal. (But it has heavier tails than the normal distribution.)
d. BETADIST
Calculates the CDF of a beta distribution. It can model data bounded between 0 and 1. E.i., proportions, percentages, or probabilities. It’s also useful for modeling skewed data. To either the left or the right. (Negatively Skewed Distribution)
Use of Gauss Function with an Example (without “Analysis ToolPak” add-in)
How to create a histogram with a normal curve overlay. In short, overlay a normal distribution bell curve on top of your histogram.
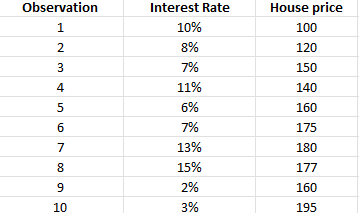
1. Choose a data set, for example
(this one below, with 100 data points)

2. Calculate min, max, mean, and standard distribution

Create a pivot table for the data set range of cells, and choose the location of the table in your spreadsheet.
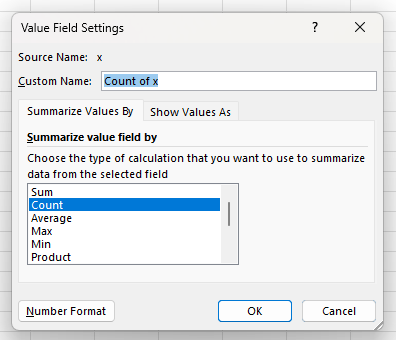
Then, insert (drag and drop) X values into “Rows” and “SUM Values”. After that, you will enter “Value Field Settings” as shown in the picture.

Once you are in the “Value Field Settings” you will choose the type of calculation you want to use to summarize data from the selected field as “Count”.
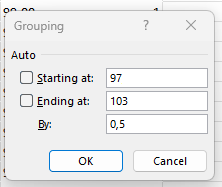
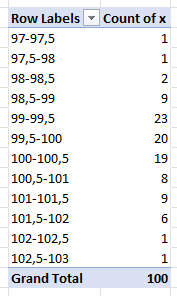
Now, right-click a data value in your pivot table and click on “Group…” and a “Grouping” tab will open, in which you will select how to group the data. In this example, we start at 97 and end at 103, grouped by 0.5.
Now that you have a data table with grouped data point ranges.
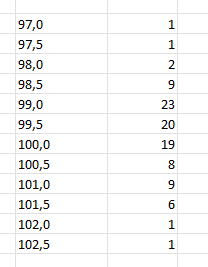
Copy and paste the “Row Labels” from the pilot table and delete the second point in each range so exact data points remain.
We are doing this because we need to get creative to make the normal distribution bell curve for the data set. But first, we will need to create the histogram graph.
4. Create the histogram
Insert a “Scatter with Smooth Lines” chart. Add in error bars, and delete the horizontal error bar lines as well as the smooth line graph.
From here, select “No Cap” in the Format Error Bars > Error Bar Options set the vertical lines of error bars to “Minus”, so they start at the smooth line curve, and set them to 100% so they end at the horizontal axis.
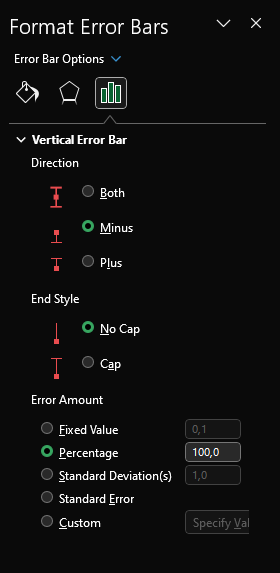
Now click on the “Fill and Line” icon and change the width of the vertical error bar lines so they become a histogram.

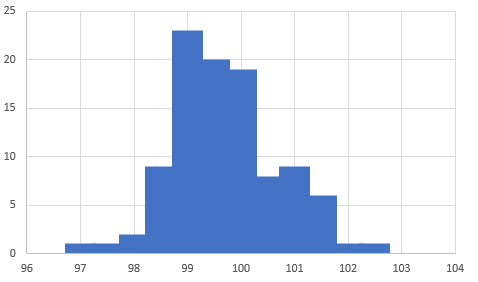
The result you get should look something like this. As you can see the error bars now resemble a histogram. And their tops are ending where, now invisible, smooth graph line was previously.
The X-axis shows the values of X while the Y-axis shows how many of these values are there.
5. Overlay the bell curve
5.1 Bell curve
First, you should calculate “Inc”, the increment, which is done by multiplying 6 with Standard Deviation you calculated in the beginning and dividing by 100. (Stedv * 6%)

Now make another table, which will serve as the basis for the bell curve overlay.
The first column should contain “Points” from 0 to 100.
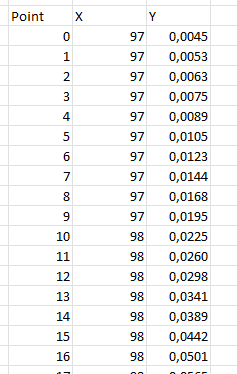
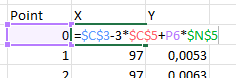
The second column should be for new “X” values that will be calculated without the use of the add-in mentioned before,
using a formula: = Mean - 3 * Standard Deviation + Point * Inc
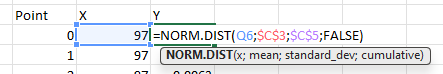
The third column should contain “Y” values that are calculated using the normal distribution function.
The function goes as follows:
= NORM.DIST ( X value; Mean; Standard Deviation; FALSE)
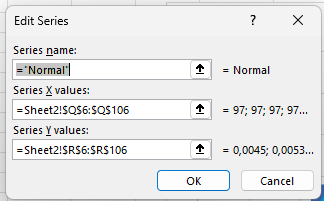
Now, add this data for the curve into the chart with the histogram. Do this by going into the “Select Data Source” tab for the chart with the histogram and adding a new series. In this case, it is named “Normal”. Select the range for X and the range for Y, not including the labels of the columns.
The result should look something like this.

All that is left to do is to plot the mean, -1 sigma, and 1 sigma.
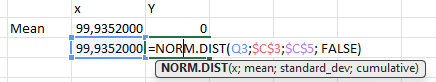
5.2 Plotting the mean
For X, the standard deviation is used, and for the standard_dev in the formula you can use the same value. See the screenshot of the formula for calculating the top Y value for the mean vertical line that will go from Y=0 and touch the bell curve exactly.
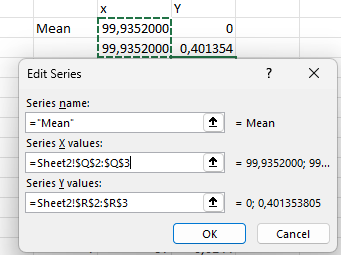
Plot it into the graph as you’d any other data table, with X and Y values.
5.3 Calculating sigma X and Y values
Here, you will use the same principle for X and Y values and the same series entry method. But there are some differences.
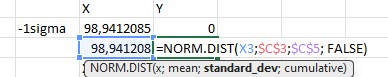
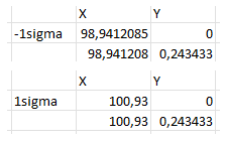
5.3.1 -1 sigma
To calculate the X value for -1sigma, you should subtract the Standard Deviation from the Mean as:
= Mean - Standard Deviation*1
To get the Y value again use the normal distribution function as
(Use the same standard dev, and mean you calculated in the beginning, and for X use the X value which you calculated in the previous step for -1sigma.)
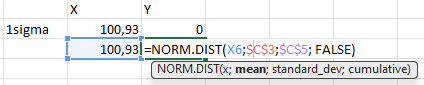
5.3.2 1 sigma
Here, it is the same thing as with -1 sigma, except you add the mean and standard deviation instead of subtracting them.
= Mean + Standard Deviation * 1
5.4 Plotting sigmas
Insert 2 new series. One for -1 sigma and the other for 1 sigma, as shown before for the mean.
6. The End result
The result of the graph should look something like this.

What are Pros and Cons of Gauss function in Excel data analysis?
It is a useful tool in Excel data analysis. Below are the identified pros and cons, which should be of concern to you. Especially if you want to apply the function with efficiency.
Take a minute to see some key advantages and drawbacks to keep in mind when using the function in your analysis:
The pros are:
- The function is excellent for smoothing out noisy data. As well as making trends and patterns easier to spot. Even if/when there's some level of variability in the data.
- You can use it to fit a curve to a set of data. This can help predict future trends. Or, understanding how different variables relate to each other.
- You can use the function in statistics and other fields. That's why so many users are already familiar with its properties. While also not forgetting its useful applications.
- Excel provides several built-in formulas. Such as NORMDIST and NORMINV. They can help simplify the process of working with these functions.
The Cons are:
- The function can be prone to overfitting data. This means that it may not capture the underlying trends or relationships in the data set.
- On some occasions. The function could turn out to be complex and difficult to work with. Especially if you're still a novice in using Excel.
- It may not be the best choice for certain data sets. Such as those with extreme outliers or non-normal distributions.
- Do you want to use it with efficiency? You'll often need a deep understanding of statistics and advanced Excel techniques. This may be beyond the skill level of some users.
In general. The function can be a valuable tool in Excel data analysis if you use it with care. And keep an understanding of its limitations in mind.
Simplify data with Gauss function Excel formula
Below is a step-by-step guide. It will explore and break down how to improve your data analysis by using the function. The steps include setting up and getting the right calculations. They will be input into the formula. (The process described before).
Step 1: Identify the data set
You need to select the data set you want to analyze before you can use the formula in Excel. It should be a set of continuous data that follows a normal distribution. As these are the conditions that allow the formula to come up with an accurate calculation.
Step 2: Calculate mean and standard deviation
You need to calculate the mean and standard deviation next. You can do this easily by using the built-in Excel functions "AVERAGE" and "STDEV".
Step 3: Apply the Gauss function
With the mean and standard deviation now calculated, you can apply the function to your data set by inserting the calculated values into it.
Step 4: Analyze the results
Once you calculate the results, you can use them to analyze your data set. For example, using them to determine the probability of certain events occurring.
This is particularly useful in fields such as finance, where probability analysis helps investors make more informed decisions.

What are the applications of the Gauss Function in Excel?
One of its significant uses is in curve fitting. It involves identifying patterns and trends in a set of data points. By fitting a curve to the data, the function helps one get a good understanding of the underlying trends. Hence, helps make informed decisions.
This technique finds use in various fields. Such as medicine, engineering, finance, and scientific research. Where accurate data analysis is pivotal.
Moreover, the function also serves as an important tool in signal processing. It's possible to apply the function to filter out unwanted noise. As well as inferences within a signal. This process results in a cleaner and more accurate signal.
These types of applications also fall into many fields. Some vital, such as:
- Telecommunication
- Biomedical engineering
- Speech recognition technology (here, clear signals are essential for success)
The versatility and accuracy of the function make it an essential tool. Making it essential for anyone working with data. Understanding how to use it is a critical skill. It can help professionals uncover valuable insights that might have otherwise gone overlooked.
The formula has many applications and is a vital tool in many fields. Comprehending its applicability and usage is pivotal. That's due to the valuable insights it can provide, and the vast upside that comes with it.
Which techniques with Gauss function can simplify complex data analysis?
The function is a leverageable mathematical formula. It can simplify complex data analysis with efficiency. It combines versatility and adaptability.
This makes it an indispensable tool for tackling large datasets. Especially ones that may seem overwhelming for standard analytical techniques.
Using it in Excel is a great way to maximize the potential of the function. Here, it can support advanced techniques and enhance your data analysis to the next level.
Here are some techniques you can use with the formula to simplify complex data analysis:
- You’re able to analyze large data sets. By splitting them into smaller subsets. And then using the formula to analyze each subset on its own.
- To identify correlations and make predictions. Use the formula to perform regression analysis on your data set.
- Identify trends and patterns over time, and use the formula to analyze time-series data.
- Use the formula to analyze multivariate data to identify complex relationships between variables.
Overall, simplifying complex data analysis using this formula involves adopting advanced techniques.
These techniques can uncover valuable insights. You can leverage the power of the function to its fullest potential. And thus, gain a deeper understanding of your data analysis. The following will be. You make more informed decisions and add value to your business.
How to do Linear Regression Analysis with a Gauss Function in Excel?
Linear regression analysis is a powerful tool for identifying correlations between variables. Thus, make predictions based on those correlations.
A useful technique for doing this is to use the function in Excel to calculate the regression line. The formula can make linear regression analysis way easier and more precise. Thus allowing you to uncover the wanted results with accuracy.
Here are the steps to use the function in Excel for linear regression analysis:
1. Organize your data
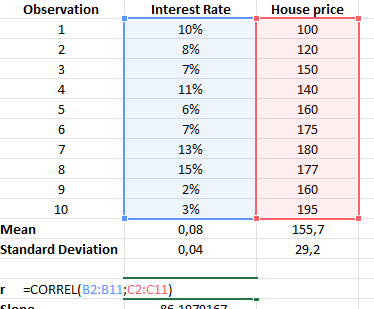
First, enter your data into an Excel spreadsheet and then organize it into columns. Ensure that each row contains data points for a single observation. Each column must represent a single variable.
2. Calculate the mean and standard deviation
Use Excel's built-in functions. Calculate the mean and standard deviation of your organized data set.

The mean represents the average value of variable observations. While the standard deviation measures the spread of the variable's values. These statistics are essential for calculating the regression line.
3. Use the formula
Now, to calculate the regression line for your data, you can finally use the Gaussian formula (normal distribution formula) to calculate the probability distribution. It uses the mean and standard deviation. It calculates the slope and intercept of the regression line.
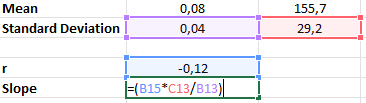
R = CORREL( X values column range; Y values column range)
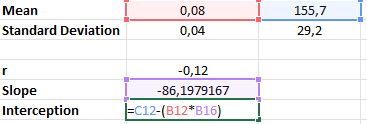
Slope = (R * Standard Deviation of Y ) / Standard Deviation of X
Intercept = Mean of Y - (Slope * Mean of X)
An alternative is to use premade formulas.
For slope: =SLOPE(X column; Y column)
For interception: =INTERCEPT(X column; Y Column)
4. Visualize the regression line
And last. Use Excel's graphing tools to visualize the regression line. As well as identify any outliers or anomalies. A scatter plot can display the relationship between two variables. While the regression line provides an estimate of how they relate to each other.
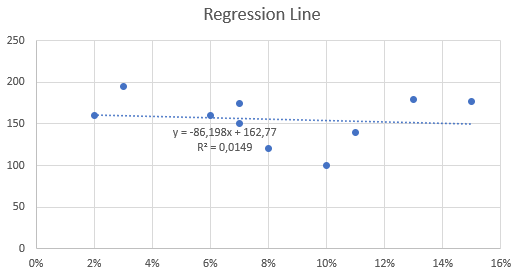
By following these steps, you can perform linear regression analysis. Identify correlations in your data. And, make predictions based on those correlations more accurately. The function formula can help make this workflow easier and more precise.
Cases of Gauss Function in Excel
The function has proven to be a valuable tool in various industries. As it provides accurate predictions and critical analytical insights.
Among the many use cases, predictive modeling is one of the most common applications. In finance, marketing, and healthcare. Predicting the outcomes of complex models can be challenging.
The formula has a great place in these mentioned industries as a tool for various activities. For example, Activities such as sales forecasts, examining customer behavior, and diagnosing medical conditions:
1. In financial analysis
We use the formula to assess investment portfolios. Calculate asset pricing models, and mitigate risks. It's particularly effective in modeling asset returns and evaluating investment performance. It offers useful insights that help investors make crucial decisions.
2. Quality control
It is another industry that benefits from the formula. By analyzing data sets such as defects per unit or product dimensions. Manufacturing companies can identify patterns and trends in production processes.
3. Statistical analysis
Here, it can assist in identifying the root cause of issues. Thus improving product quality.
It is particularly useful for predictive modeling, financial analysis, and quality control. It provides businesses with valuable insights that can help them make informed decisions. As well as mitigate risks, and improve operations.

How can the Gauss Function in Excel improve decision-making?
One of the most powerful tools available to businesses today is this exact function in Excel.
We use this advanced formula to provide accurate data modeling and analysis. It helps organizations make informed decisions that can drive better outcomes. Cut the risk, and improve performance.
When used well. The functions of the Excel formula can have a significant impact on an organization's competitiveness. As well as thrive in today's fast-paced business environment.
1. Accurate data modeling
Businesses can identify patterns and trends. Those that may not be visible through other methods. By analyzing large volumes of data, the formula helps make sense of complexity. And, use that information to inform decision-making.
2. Predictive modeling
We use these models to forecast outcomes. This allows businesses to plan and make reliable strategic decisions because they're based on the reliability of the model's information.
Note
Gauss Function Excel formula is particularly useful in industries where accurate forecasting is essential.
3. Identifying areas of improvement
By analyzing quality control data, businesses can identify areas of project streamlining possibility. Or, making them more efficient. This can lead to significant cost savings, as well as improved performance.
By providing accurate data modeling and analysis. As well as predictive capabilities, and process improvement opportunities, this formula delivers. Help organizations thrive in today's competitive business environment. We recommend you're wise when using the formula. Thus, you'll ensure the largest strategic impact and optimal outcomes.
What are the limitations of the Gauss Function in Excel?
While it is a powerful tool for data modeling and analysis, it does have some limitations that should be considered. We’ve broken down a few examples:
- Assumptions: The formula assumes a normal distribution of your underlying data. So, it is very important to note that if these assumptions aren’t met the end results may not be as accurate.
- Complexity: The formula can be complex and difficult to understand if you’re someone who isn’t really familiar with statistical analysis. But a little support or training would go a long way to get you familiar with the formulas, applications, and usability.
- Data requirements: The formula requires a significant amount of data to produce accurate results. Now of course, if the data is incomplete, or even worse, inaccurate, the results shouldn’t be considered reliable in any way.
Additionally, it is already known that the formula is sensitive to outliers and extreme values within your chosen data set. Meaning end results can be quite skewed, which makes it quite difficult for you to draw accurate conclusions from the data.
If you’re aware of these limitations and their importance and also use the formula in conjunction with other statistical tools and techniques, you can be ensured that your results will come out to be nothing less than accurate and reliable.
What are the advantages of the Gauss function Excel formula?
As a professional in any of the applicable fields. You should be aware of the importance of the functions' advantages.
The formula ensures accurate data modeling. It allows analysts to predict and analyze trends in data with greater precision. This level of accuracy is essential. In decision-making processes that are derived from reliable data analysis.
- Speed: The formula is faster than manual data analysis techniques. Therefore, it saves time and increases productivity. Instead of spending hours calculating data by hand. You can use it to speed up work.
- Versatility: Its applications span a broad range of tasks in data analysis. This allows analysts to apply it to probability distributions. As well as linear regression analysis, and advanced data analysis techniques.
- Simplification: Besides its versatility. The formula simplifies complex data analysis tasks. This feature makes it ideal for beginners. As they may not have the key technical skills. Those skills help you navigate complex data analysis tasks by hand.
In general. The advantages of the formula make it a valuable tool for data analysts. Its accuracy, speed, versatility, and simplification. These are essential features that facilitate data analysis tasks.
By incorporating the function's formula into your tool kit. You can, as an analyst, streamline your work and enhance productivity.
Which are common errors and problems you may encounter?
When working with the formula, the possibility of encountering some errors or problems could be considered a no-brainer, especially if you’re not as familiar with the matter. Feel free to check out our Excel modeling courses.
Issues that sometimes occur can be frustrating, but keep in mind that they're usually easy to fix. We’ve identified some of the most common errors and problems that you might encounter when using the formula, along with tips on how to fix them:
- #NAME? error: this error message indicates that Excel can't recognize the formula you're using. To fix this frustrating mistake, be completely sure you've correctly spelled the formula and included all necessary arguments.
- #DIV/0! error: an error message such as this one indicates you're trying to divide a number by zero or an empty cell. But luckily for you, it can be simply fixed, by just checking the formula and making sure you're not dividing by zero.
- Incorrect results: Perhaps the end result you are getting isn’t matching with what you’ve expected from the formula. Make sure to double-check if you've entered the correct input values and included all necessary arguments. Also, are the formula and interpreted values correct?
- Missing function: if you're trying to use the formula but can't find it in the list of available functions, it's possible that you don't have the “Analysis ToolPak” installed. To install this add-in, go to the Excel options menu, click add-ins, and then select “Analysis ToolPak”.
How has the Gauss Excel Formula Evolved?
The formula has evolved since its initial development, undergoing significant changes and refinements.
The most notable and one of its most significant changes. It was the introduction of the central limit theorem. This theorem states the following: "The large sum of independent and identically distributed random variables will converge to a normal distribution."
The Function has since adopted this concept and has become a powerful tool. For example, statistical analysis. Another critical development that affected the evolution of the function. It is the sole creation of the standard normal distribution.
It uses a function equation with a mean of zero and a standard deviation of one. This standardized version has since become a standard reference point for statistical analysis. As you may know, in data modeling as well.
In more recent years. It has become adopted in the development of artificial intelligence. And also, machine learning technology. That is due to its modeling and predictive capabilities.
As data analytics and technology continue to expand and improve. The function will likely continue to evolve with it. And start to offer new and exciting applications. For an ever-growing range of industries.
Keep this in mind while using Gauss function Excel formula
When using it, please be sure to keep in mind a few important things, so you know the results you’re getting are indeed accurate. We’ve identified some key considerations to remember for efficient use down the road:
- Input Range: It must be consistent and selected correctly. You must make sure you have selected the correct range of data you want the formula to work on. Otherwise, if you miss this small mistake, you’ll become frustrated while not knowing what the problem is.
- Arguments: Formula requires three arguments: X, Mean, and Standard Deviation. It is important to enter these values correctly, of course, as incorrect inputs lead to errors.
- Excel version: The formula is available in Excel 2010 and later versions, meaning, if you are using an earlier version of Excel, the formula will, blatantly put, simply not work.
- Interpretation: Formula returns a probability density for a given value of X. This value represents the probability of X occurring in the normal distribution.
- Context: Remember that data analysis is only part of the decision-making process. Make sure to strongly consider the context of your analysis and how it relates to your overall goals, so the calculations don’t resonate with the wrong opinions that could shift your decision-making.
- Validation: Never rely solely on the formula itself, to validate your data. We strongly urge you to not solely rely on one specific source but also to use other validation methods that support the meaning and accuracy of the results of the formula. Examples of other techniques that work well with the formula and validate its end results, by giving you a more comprehensive understanding, are hypothesis testing, data visualization, etc.
By keeping these considerations in mind, you can ensure that you receive reliable results from the formulas used in Excel.


or Want to Sign up with your social account?