Dynamic Dates, Sum, Average and Scenarios
Effective financial functions that can aid individuals and companies in more knowledgeable decision-making


Dynamic Dates, Sum, Average And Scenarios In Excel
Four effective tools, Dynamic Dates, Sums, Averages, and Scenarios can aid individuals and companies in making wiser financial decisions. These instruments are frequently employed in resource allocation, risk management, budgeting, forecasting, and financial modeling.

How to Define Dynamic Dates? These dates are changed depending on a preset set of criteria or formulas. For example, the financial model includes the start date, termination date, or any other pertinent date. It may serve as the foundation for these regulations.
Dynamic Dates are helpful because they do not need manual updating of dates each time. Instead, the model is modified or updated, saving time and minimizing errors.
The usage of Dynamic Dates in forecasting and budgeting is quite widespread. Dynamic Dates, for instance, can be used to update revenue automatically. It estimates values depending on the current year, the start year, and the end year.
Financial reporting is another area in which Dynamic Dates are used. It can automatically update a report based on the current month and the prior 11 months. So, for example, if a corporation needs to show its financial performance for the last 12 months, it is easy to spot patterns and improve.
Suppose a company wishes to forecast its revenue for the following three years. As a result, it is simple to compare anticipated and actual revenue. And make any necessary adjustments.
-
Dynamic Dates, Sums, Averages, and Scenarios are effective tools in financial decision-making, modeling, and analysis.
-
Dynamic Dates automatically update based on criteria, saving time and reducing errors in financial models.
-
Sums and Averages add and average numbers, essential for financial modeling and analysis.
-
Scenarios help assess financial models' sensitivity to variables, aiding risk control and decision-making.
-
These tools are widely used in financial applications for accuracy and adaptability.
Sum and Average
Two fundamental mathematical operations are sum and average. These are used to add and average numbers, respectively. These functions are frequently used in financial modeling, budgeting, forecasting, and analysis.
To add up a group of numbers, use sum. For instance, a business can use the SUM function to add up the revenue for each year if it wishes to determine the total revenue for the previous three years. This makes it simple to determine areas for improvement by comparing the total revenue with the goal revenue.
To determine the average of a group of numbers, use the average. For instance, a corporation can use the Average function to divide the total revenue by the number of years to get the average revenue for the last three years.
This makes it simple to assess the company's performance and compare the average revenue to the sector average.
What are Scenarios?
Scenarios comprise financial modeling, planning, forecasting, and analysis to determine how sensitive financial models are to various variables. Scenarios are frequently used to control risks, spot opportunities, and use available resources.

Three categories of scenarios exist:
- Upside
- Target
- Downside
Positive scenarios with a higher-than-expected performance are called upside scenarios. Target scenarios are hypothetical situations that consider a typical performance.
Negative scenarios are pessimistic scenarios that presume a less-than-anticipated performance.
Scenarios are beneficial because they aid decision-making by assisting people and organizations in planning for potential outcomes. For instance, if a business wants to invest in a new project.
Using scenarios, it can assess the project's sensitivity to several factors, such as sales, expenses, and market circumstances. This makes it simple to assess the project's risks and benefits.
Where Are Scenarios, Sums, and Dynamic Dates Used?
Due to their adaptability, accuracy, and capacity to produce current data, dynamic dates, sums, averages, and scenarios are utilized in various financial applications.
Dynamic financial modeling is a crucial tool used by financial analysts, accountants, and other financial professionals. One prominent application is developing intricate financial models that reflect current market conditions and adjust to future changes.
Dynamic dates are used in dynamic financial modeling. To provide financial data more accurately and currently, experts can track changes in financial data and adjust their models under them.
Moreover, sums and averages are crucial computation techniques for totaling and averaging financial data.
Financial professionals may assess and comprehend vast volumes of data. Therefore, the support of these formulas is essential for making wise financial decisions.
Budgeting is a crucial area in which dynamic dates, sums, averages, and scenarios are used. All companies must have a budget since it assists with planning and resource allocation. In addition, these are helpful for budgeting since they let businesses construct adaptive budget templates.
They are simple to update and change when necessary. This makes it simpler for businesses to manage their finances and change their budgets to account for shifts in the market.
Note
The computation of budget data totals and averages also depends on sums and averages. Organizations may examine their budgets using these formulae and spot areas where they need to make changes.
Finally, scenarios effectively evaluate a budget's sensitivity to different factors. For example, organizations can check the effects of changes in market conditions, such as interest or currency rates, on their budgets by developing several scenarios.

Dynamic dates and time periods using IF statements
Below is the procedure, along with shortcut keys, for generating dynamic dates and time periods using IF statements:
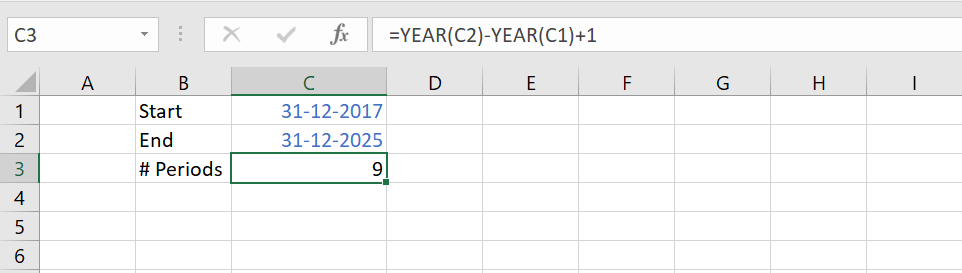
Step 1: Set the model's beginning and end dates. To show hard-coded numbers, change the font color to blue.
Step 2: Use the formula =YEAR(C2)-YEAR(C1)+1 to determine the total number of periods. Because the beginning and ending periods are counted, add one period.
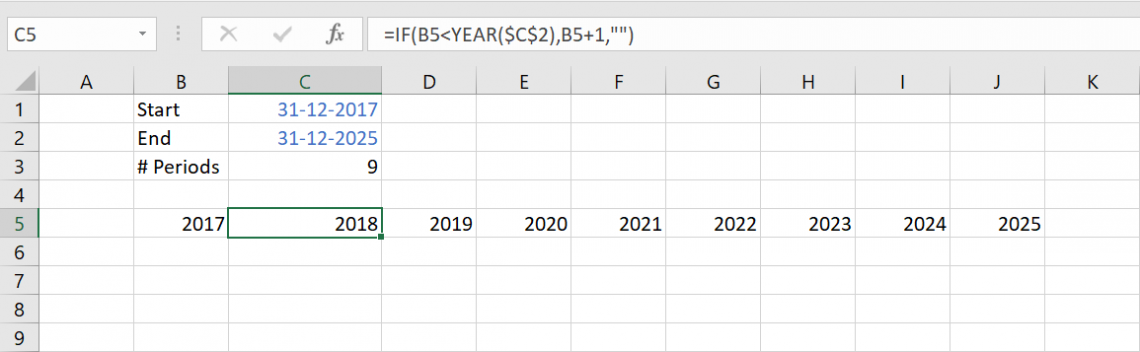
Step 3: Use formulas to set up dynamic dates across row 5. Enter the start date in cell B5 using the formula =YEAR($C$1), and press F4 to anchor the cell reference.

Step 4: Enter the expression =IF(B5<YEAR($C$2),B5+1,"") in cell B6. Hold SHIFT and the right arrow to fill down the cells while pressing CTRL + R until the end date. It will fill the cells on the right.
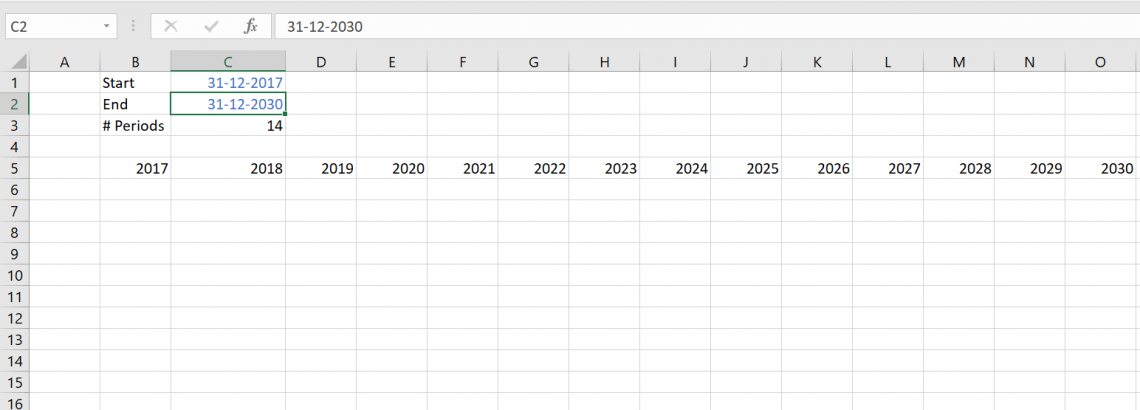
Step 5: Without going through each cell manually, change the dates. For instance, to automatically fill the cells on the right until 2030, change the end date to 12/31/2030.
Step 6: To open the Format Cells window, press CTRL + 1 after selecting the entire date section with SHIFT + CTRL + right arrow. Press OK after changing the font's color to white and the fill to a deep blue.
Step 7: To make the font bold and increase the size to 12, press CTRL + B. All of your financial analysis now flows beneath a header.
It is quicker and error-free to generate dynamic dates using IF statements. You may quickly change the start and finish dates and immediately refresh the full date area.
This method is particularly helpful in financial modeling and other situations where dates and times are involved in the data processing.
NOTE
You may complete the process quickly and effectively using shortcut keys. It will improve the accuracy and dependability of your financial analysis.
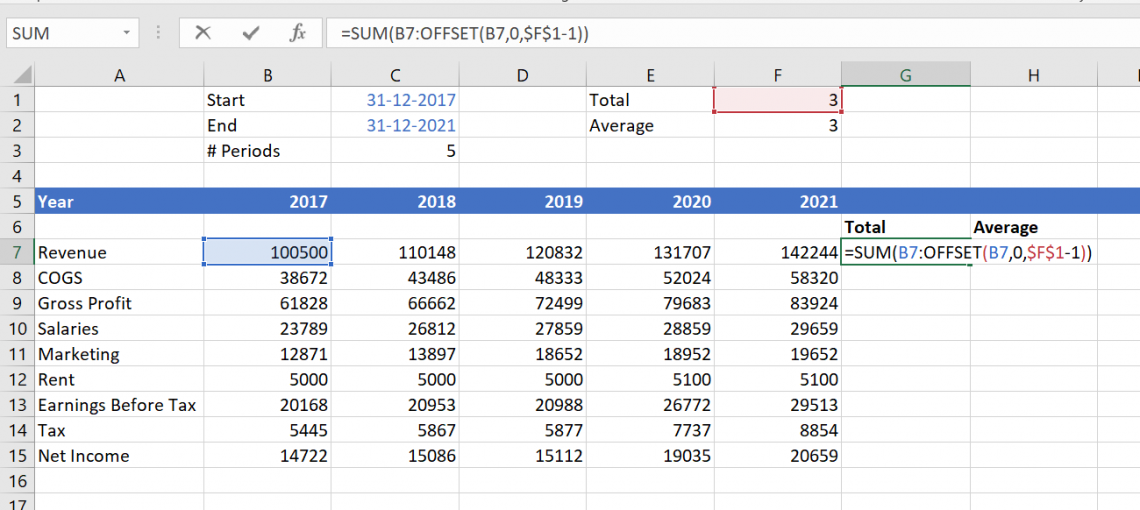
Dynamic totals and averages with the OFFSET function
To track financial success over time while developing models, Dynamic totals and averages are essential. You can use the OFFSET function to automatically calculate totals and averages for each period rather than doing so by hand.
The steps are as follows, including shortcut keys for speed:
Step 1: Include the start and finish dates when entering your data into the spreadsheet.
Step 2: To add two columns to the left of your start date column, press ALT + I + C twice. The dynamic totals and averages will be calculated using these.
Step 3: Type "Total" in cell G1 and "Average" in cell G2. Beside both cells, enter the number of periods you want to factor into the computations.
Step 4: Cell B8 should be the first cell selected in the Total column. Type the formula =SUM(D8:OFFSET(D8,0,$H$1-1)) into this cell. You can choose a range of data using the OFFSET function based on the number of periods you want to include, which you enter in cell H1. Type ENTER.
Step 5: Like the SUM function, the AVERAGE function is used in the formula for the Average column: =AVERAGE(D8:OFFSET(D8,0,$H$2-1)). The number of periods' cell references is H2. Cell C8 in the Average column should be selected.
Then, select the entire column by pressing the SHIFT + down arrow, and fill down the formula by pressing CTRL + D.

Step 6: Your dynamic totals and averages are now computed and shown in the corresponding columns for Total and Average.
While creating models, use shortcut keys. For example, adding columns, entering calculations, and filling down cells save time and effort.
You may concentrate on evaluating performance and developing a business strategy by automating calculating totals and averages.
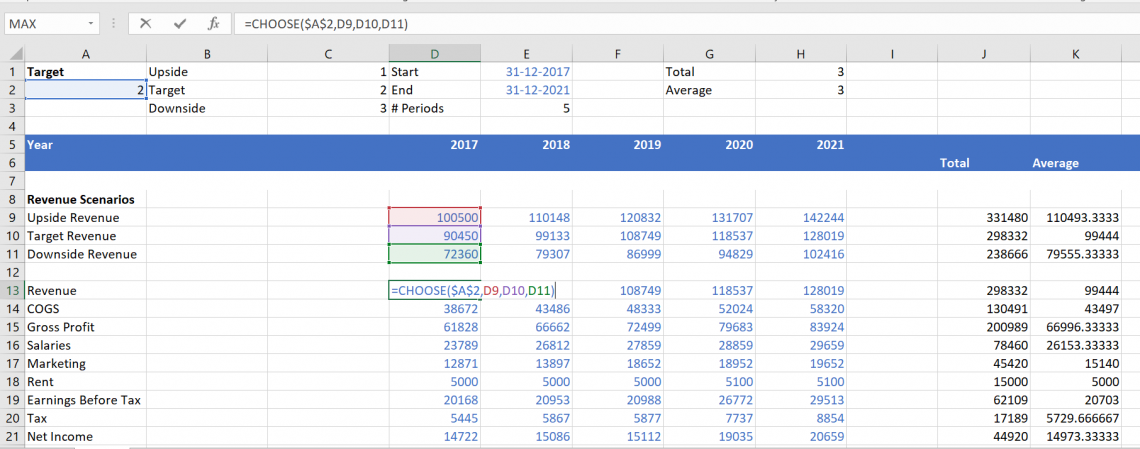
Scenarios with the VLOOKUP and CHOOSE functions
Here, we'll look at developing a dynamic revenue model in Excel using the VLOOKUP and CHOOSE functions. We will first create a drop-down list for each scenario to display the correct revenue for each scenario.
The CHOOSE function will develop a dynamic revenue line that alters according to the specified scenario.
The model will then be formatted as necessary once we connect the labels for the total and average to the number of periods.
Step 1: Cells B1 to B3 should be filled with the names of the upside, target, and downside scenarios.
Step 2: By choosing cell A1, hitting ALT + A + V + V, selecting List, and choosing cells B1 to B3 as the source, you may create a drop-down list for the scenarios. By pressing CTRL + 1, you may format the drop-down list by making the typography bold and the cell color different.
Step 3: Cells C1 to C3 in the scenario's three scenarios are numbered.
Step 4: The scenario name in the drop-down list should match the case number in cell A2 using the VLOOKUP function. Put in the formula box: =VLOOKUP(A1,B1:C3,2,FALSE).

Step 5: Add four rows beneath revenue to display the three possibilities. These should be called Upside Revenue, Target Revenue, and Downside Revenue. Fill in the numbers in cells E8 to I10 for each scenario.
Step 6: Create a dynamic revenue line that selects the appropriate alternative under the scenario chosen using the CHOOSE function in cell E13. By typing =CHOOSE($A$2,E9,E10,E11) and pressing SHIFT + right arrow and CTRL + R, you may copy the formulas to the right.
Step 7: Use CTRL + D to fill out cells B10 through C11. Formulas should be copied and pasted from cell B11 to cell C11 to cell B13.
Step 8: Connect the labels for the total and average to the number of periods shown in cells I1 and I2. Enter =I1&"-Yr Total" in cell B6 for the total label and =I2&"-Yr Avg" in cell B7 for the average label.
Step 9: Make net income, earnings before taxes, and gross profits formulas to connect them.
Step 10: Lastly, format the model as you see fit.
Dynamic Dates, Sums, Averages, and Scenarios FAQs
Excel OFFSET function can be used with the AVERAGE function to calculate the average dynamically.
Using the OFFSET function, you can select a starting point and shift to a different location inside the worksheet. Here is an example formula for calculating an array of cells' averages dynamically:
=AVERAGE(OFFSET(A1,0,0,1,B1))
A1 is the initial cell in this formula, while B1 denotes the number of cells used in the calculation. Excel is instructed to begin at cell A1 and only include the first row in the range by the "0,0,1" parameters. You can change these arguments to match the range of cells you want to average.
Excel OFFSET function can be used to calculate the total dynamically. Here is an illustration of a formula to determine a dynamic range's sum:
=SUM(first cell : OFFSET(first cell, 0, number of periods - 1))
The cell reference for the first cell in the range you want to sum should be substituted for "first cell" in this formula. And "the number of periods" should be changed to the total number of cells in the range you wish to sum.
For instance, if cell A1:A5 has the values you like to sum, and cell B1 includes the number of cells you wish to sum. You may use the following formula:
=SUM(A1 : OFFSET(A1, 0, B1-1))
The value in cell B1 will determine how the range is dynamically adjusted to sum.
The average dynamic range in Excel is a set of cells that calculates the average depending on the number of entered data points.
Use the OFFSET function in conjunction with the SUM function in Excel to dynamically build a sum formula.
A reference to a range that is a given number of rows and columns from a specified starting cell or range is returned by the OFFSET function.
This function can build a range with the required number of cells for the sum. After that, add up the numbers in that range using the SUM function.
The sum formula can be made dynamic by changing the starting cell reference in the OFFSET function to update when new data is added.


or Want to Sign up with your social account?