Projecting Balance Sheet Line Items
The process of forecasting the future financial values on a company's balance sheet.


What is Forecasting Balance Sheet Line Items?
Projecting balance sheet line items refers to the process of forecasting the future financial values on a company's balance sheet.
Let's start understanding this concept with a short story: Richard is an amateur who recently started investing in the securities market. After learning the basics of trading, he started analyzing a few companies his friends had invested in.
To his surprise, he found that the balance sheet trends of a couple of companies in the same industry were quite similar.
Even after applying all the financial performance metrics he knew, he needed clarification about which company he should invest in since the derived figures were more or less equal/close by.
That is when his friend told him to check out the projected figures of the balance sheet line items for the next two years. This enabled him to clear the confusion and invest in the company whose future looked much brighter and financially well-off.
We all know that determining a company's financial position is one of the primary objectives of accounting. A position statement or balance sheet is an essential financial statement that enables companies and investors to ascertain their financial position.
Microsoft Excel is the most popular electronic spreadsheet of this age—one of the most popular software programs for data interpretation and analysis in today's corporate world.
The balance sheet is a 'Time statement' that shows the position of the company's assets, liabilities, and equity at a given time.
Hence, projecting these line items is a significant task any finance manager performs. In doing so, companies can predict their position in the future, which is beneficial for budgeting and financial planning.
This essay will delve into the features, objectives, methodology, pros, and potential cons of projecting line items of a company's balance sheet.
- Projecting balance sheet items involves predicting the values of assets, liabilities, and equity for future periods based on historical data, business trends, and assumptions about future performance.
- Projections help stakeholders, including investors, creditors, and management, understand the company's financial health, solvency, and liquidity over time.
- Projected balance sheet items should be integrated with projections for the income statement and cash flow statement to ensure consistency and alignment across financial statements.
- Consideration of risk factors, such as market volatility, regulatory changes, competitive pressures, and macroeconomic conditions, is crucial in projecting balance sheet items.
Overview of a Balance Sheet
Before we know how to interpret balance sheet line items, let's understand what a Balance sheet is.
A balance sheet is one of many financial statements companies prepare as a part of their statutory obligation, generally at the end of the fiscal quarter or financial year.
However, the Balance Sheet is a "Time Statement," i.e., a financial manager can prepare it at any point.
Also known as a position statement, this financial statement is based on the fundamental equation of accounting, as proposed by the Father of Accounting, "Luca Pacioli"-
Assets = Liabilities + Stockholders Equity
NOTE
The components of the accounting equation are a broad categorization of the accounts opened due to the numerous financial transactions the company had entered during the specified time.
A lucid and brief overview of each component and its sub-components are explained as under
Assets
Assets are monetary resources a company owns that are used to generate future income. They play a detrimental role in enhancing a company's productive capacity.
They are recorded on the right side of a T-shaped balance Sheet and placed at the downward segment of the updated horizontal balance sheet format.
Assets are generally classified into three forms depending upon their nature, namely-
- Physical assets: These refer to tangible assets that can be physically touched and seen. Property, Plant and Equipment, and Inventory are some of its examples.
- Financial assets: Includes liquid cash, close substitutes of cash like bank balances, and various financial market instruments like securities.
- Intangible assets: Copyright, Trademark, and Patents are assets of great value to their parent organization even though they cannot be seen or touched. They are generally governed under Intellectual Property Rights.
NOTE
Based on their convertibility to cash or cash equivalents, assets can be current (say, accounts receivables) or non-current (say, fixed assets and long-term investments).
Liabilities
Liabilities represent the amount the company owes from past transactions with outsiders.
The liabilities illuminate a company's financial obligation, risk, and creditworthiness. Failure to meet such commitments can invite legal action and financial penalties.
They are recorded in the financial statements in the order of their respective due dates and are a good measure of assessing an organization's overall financial health. A side-by-side check regarding the organization's finances is always advisable to pay off the debts incurred.
The liabilities can be further segregated into
- Current liabilities
- Non-Current Liabilities
1. Current Liabilities
Being an essential constituent of the "current ratio" and "quick ratio," the current liabilities refer to the short-term financial obligations that must be paid off within the normal operating cycle.
Account Payable, Bank Overdraft, Unpaid dividends, Calls in advance, o/s Interest on calls in advance, Provision for tax, and Proposed dividend are some of its examples.
2. Long-Term Liabilities
Refer to the long-term financial obligations such as bonds and mortgages, which are due in the period extending beyond the current normal operating cycle of the company.
These liabilities are generally paid off by following a long-term payment scheme, i.e., payment in a lump sum is undesirable or unfavorable.
They can severely affect an organization's creditworthiness, and piling interest on the due amount may hamper the profitability and cash flow.
Some examples of long-term liabilities include
- Long Term borrowing (Debentures / Bonds, Mortgage Loans, Public Deposits, etc.),
- Intercompany Owings from associates and subsidiaries,
- Long Term provisions like Provident Fund, Gratuity Fund, and Provision for Pension Fund.
Equity (Shareholder's Fund)
Shareholders' funds or equity represent the Company's Net Worth. They indicate the shareholders' contribution towards the company.
The main components of shareholder's funds are stated as follows:
- Share capital (money invested by them in the company)
- Retained earnings (undistributed profits)
- Free and specific reserves (say, General Reserve, Capital Redemption Reserve, Securities Premium Reserve)
It is an essential balance sheet item as equity measures the company's ability to raise capital, grow, and diversify.
As an essential source of financing for companies, equities represent the shareholder's funds and any retained earnings reinvested in the company.
It is used to finance various operations of an organization, such as making investments, buying back shares, and paying dividends.
Additionally, metrics, namely, Return on Equity and Earnings Per Share, highlight the company's financial health. Hence, this balance sheet component comes in handy to assess a company's ability to generate long-term profits and pay dividends to shareholders.
Features of Projections
By 'Projecting balance sheet line items,' we refer to the process of estimating the expected future values of assets, liabilities, and shareholders' equity.
Various statistical and analytical tools like regression analysis, industry benchmarks, historical trends, percentage of sales, and assumptions are used herein.
The key features of projecting balance sheet line items are
- Historical Data: The company's performance in the past forms the basis for analyzing future trends and making projections.
- Flexibility: The time span for projections can be flexible depending on the organization's needs. Hence, projections can be as short as that monthly or for five years.
- Subject to Accurate Data: Complete and Accurate data is the basis for constructing a reasonable estimate. These projections may lose efficiency if sound reasoning and accurate data are not used.
- All Pervasive: Financial projections are based on the accounting assumptions the accountant has applied while recording the company's financial transactions.
However, the application of this concept is all-pervasive, adjusted with some changes in methods for each industry.
Objectives of Projections
As discussed above, the main motto of a company preparing its balance sheet is to determine its financial position at a given time.
However, the various components of the balance sheet can be considered for computing different accounting ratios. This would help stakeholders have an overall synoptic image of the company's financial health.
Projecting and Interpreting Balance Sheet line items to help in attaining the following objectives:
- Assessing the Overall Financial Position: The balance sheet line items allow stakeholders to learn a lot about the company—its assets, how they are utilized, whether it is creditworthy, and how it manages its finances.
- Critical analysis of these questions helps them to chalk out the organization's current and future financial position.
- Tool for Financial Analysis: Accounting ratios are the most popular metric for assessing financial position concerning several parameters. Line items of the Balance Sheet provide the basis for the financial ratio analysis.
- Budgeting: Estimating an organization's expenditure and revenue flows is known as forecasting. Inter-branch and Inter-Departmental Balance Sheets illuminate the financial health of the concerned departments/projects and thus provide a basis for determining the future course of action.
- Potential Risks: It facilitates forecasting the organization's future financial position, which can help companies identify potential risks and opportunities and thus guide them to act accordingly.
Lastly, Balance sheet line items have a significant role in capital investments, debt financing, dividend payouts, and other activities.
Projecting Balance Sheet line Items using Excel
In today's tech-savvy world, the manual accounting system is applied while solving Accounting Problems of the school/university curriculum!
Corporates follow a fully digitalized accounting system, carrying out all the relevant operations/transactions through dedicated accounting packages like SAP and TALLY.
Electronic Spreadsheets are integral to an organization's accounting database as they are secured, structured, and organized.
The transparency and easy-to-use built-in tools of Microsoft Excel make it powerful for projecting balance sheet line items. The following steps are followed:
1. Accumulation of Historical Data
Historical data refers to the company's past balance sheets, income statements, and cash flow statements. It is collected to identify trends and patterns across various periods, which can help make projections.
2. Creating a Benchmark for Future Financial Performance
The company then assumes its future financial position backed by sound reasoning and research.
Such assumptions should be adjusted by factors affecting financial performance (like revenue growth rates, cost of goods sold, inflation rates, and interest rates).
3. Creating a Pro-forma Income and Position Statement
The main motive behind creating these proformas is to assess the organization's financial position and performance, both for the current period and the projected figures for the years to come.
NOTE
In MS Excel, the SUM function is used to create Pro-forma Income and Position statements.
First total revenue and cost of goods sold (COGS) are computed, followed by a subtraction of the cost of goods sold from the total revenue to get the gross profit. Depreciation, Interest, and Taxes are then deducted from the net profit.
For the position statement, the total value of all assets and liabilities, including shareholder's wealth, is computed.
NOTE
In MS Excel, the IF function is used to satisfy that the accounting equation holds true.
4. Review and Adjust Projections
The review and follow-up process is quintessential for any activity. Hence, the projections must be reviewed continuously in light of various economic changes and adjusted to retain relevance.
Types of Projections
Projection of the line items of a balance sheet helps the users of the financial statements to bridge the gap between the company's financial health in the present and future. Various methods can be adopted to produce projected figures about the future.
Adopting various methods is subjective and differs according to the projections' aim and the business's nature. Here are some of the most common ways:
Historical Trend Analysis
Under this method, every balance sheet line item is thoroughly examined, periodic trends and patterns are devised, and then projections are made for the specified future. However, inaccurate data and personal biases may limit the projections' efficiency using this method.
For example, if accounts receivable (debtors + bills receivable) have been growing at an average rate of 6% per year, this can be used to project the growth rate for the upcoming years.
Percentage Of Sales Method
Prevalent among the manufacturing and trading concerns alike, all the balance sheet items are computed as a percentage of sales.
NOTE
The decimal figure obtained is considered the basis of projection. However, relating every income statement component with 'Sales' may sometimes need to be more effective.
For example, Inventory Turnover has been three times per year over the last three years, and Projected sales for next year are expected to be around $2 million. Therefore, the projected inventory balance by this method would be $666,666 the following year.
Assumptions-Based Method
This method wholly involves the accountant's personal judgment. The accountant makes projections about the various balance sheet items solely based on their assumptions.
For example, suppose a business aims for expansion in the next year. In that case, there will be an inflated projection of inventories and accounts receivable to show the growth effect of sales.
Regression Analysis
By regression analysis, we can obtain the 'line of best fit' among the various items of the balance sheet and make future projections. However, the items under this method should be related (i.e., there must be some correlation among them).
For instance, if there is a strong correlation between accounts payable and purchases, regression analysis can be used to project the accounts payable balance based on the projected purchases.
Industry Benchmark
Every business belongs to some industry. Every industry has a standardized benchmark for all the components of the position statement.
For example, suppose the business is in the telecom industry. In that case, industry benchmarks can be used to project the inventory turnover ratio, accounts payable turnover ratio, and other essential balance sheet line items.
Interpretation using the Balance Sheet Line Items
By now, you must have understood that projecting line items help professionals to estimate where the company is heading. It is like trying to predict the future in the present.
As Winston Churchill rightly said, "Failing to plan means planning to fail," those companies who do not make future projections aren't clear about their future itself!
The following metrics are the most popular and come in handy while projecting the balance sheet line items:
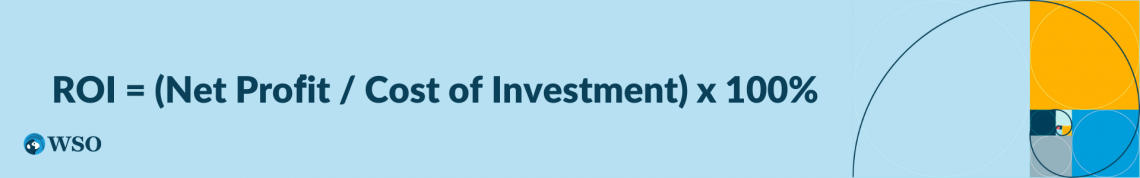
Return On Investment
In simple terms, Return on Investment (ROI) is a financial ratio that measures a business's profitability by comparing the return earned on an investment to its cost.
It shows the return from an investment as a percentage of the initial amount invested. The higher, the better. The formula for return on investment can be seen below:
Accounts Receivable Turnover Ratio
It indicates how efficiently a company collects its accounts receivables from those who owe certain money. It measures the number of times accounts receivable are gathered during a period. The higher, the better.
To maintain a healthy cash flow and liquidity, a company should always have a higher accounts receivable turnover ratio and a shorter average collection period.
The formula for accounts receivable turnover can be seen below:

Debt-to-Equity Ratio
The Debt-to-Equity (D/E) Ratio is an accounting ratio that indicates an organization's financial leverage level. It measures the amount of debt a company has about its equity in its capital structure. The lower, the better.
If an organization's Debt-to-Equity ratio is higher than its industry average, then there is excessive financial leverage and potential financial risk. The formula for debt to equity ratio can be seen below:

Working Capital
It is a crucial component of financial management, and it refers to the funds available at the company's disposal for its day-to-day work. The working capital is the difference between Current assets and Current Liabilities.
However, to be specific, the current and cash conversion ratios are two metrics used in conjunction with the working capital analysis.
Pros and Cons of Projections
Projections enable the users of financial statements to have a synoptic view of the company's future position.
Though projections don't provide the exact position the company can find itself in, the future can be predicted to a certain extent if they are done using accurate data and methods.
However, like any other analytical tool, deploying this metric has pros and cons.
| Pros | Cons |
| Improved financial planning: The projections act as a basis for the computation of other methods of profitability and solvency, like the expected Return on investment on an asset in the next year. | Complexity: Projecting the line items of a balance sheet is a tedious process requiring time, resources, research, and analytical skills. |
| Efficiency of Operations: Accurate projections may lead to the preparation of effective budgets, which in turn minimize wastage and attain operational efficiency. | Inaccurate Assumptions: Relying too heavily on assumptions can be risky and may lead to miscommunication of the projected figures to the stakeholders. |
| Historical Data: These projections communicate the organization's financial position in the future based on accurate and authentic data collected in the past concisely, eye-catchingly, and effectively. | Accuracy of Data: Projections are made, keeping the historical data as the basis. Hence the historical data must be accurate, or they may falsify the organization's future. |
| Mitigate Potential Risks: Lastly, it helps the company identify potential risks and threats and take steps to curb and mitigate them, which has a positive impact on the company's financial position. | Robust Review Mechanism: The projections must be subject to continuous review mechanisms to remain relevant even during a changed working environment (economic conditions). |
Hence, when dealing with projected figures, it is always advised to examine the methodologies adopted by the organization to construct them.
Personal bias and incomplete and inaccurate information often hamper the analysis of these projections. Thus, organizations should construct them, considering these potential obstacles.


or Want to Sign up with your social account?