Demand Theory
A principle outlining the relationship and correlation between the quantity of a commodity customers purchase and the price charged for a product.


What is Demand Theory?
The Demand Theory is a principle that outlines the relationship and correlation between the quantity of a commodity customers purchase and the price charged for a product.
According to this theory, demand refers to the quantity of a good or service a consumer is willing to pay for at a set price over a given period. Demand depends on the ability to pay for a particular good or service and purchasing power.
The consumer creates it for a product or a service. Demand is a combination of willingness, ability, and desire to purchase a commodity. The absence of either does not result in demand; however, the presence of all three factors stimulates demand.
Demand outlines the relationship between price and quantity, which conveys the various amounts of a product at alternating price levels.
The three key elements of demand are:
- Price
- Quantity
- Period
Demand Theory involves all three factors. Price in economics is defined as what is paid for by a buyer for a particular product unit. The quantity demanded is the total amount of a product unit paid for.
The period is the time taken for demand to rise or fall and is usually measured over a certain period. All combined variables contribute to the concept of ‘demand.’
- Demand theory is a fundamental concept in economics that explains the relationship between the quantity of a good or service that consumers are willing and able to purchase and the good's price.
- This theory helps to understand consumer behavior, market dynamics, and how prices and demand levels interact.
- The demand curve graphically represents the relationship between the price of a good and the quantity demanded. It typically slopes downward from left to right, illustrating the inverse relationship between price and demand.
- The central principle of demand theory is the law of demand, which states that ceteris paribus (all else being equal), as the price of a good decreases, the quantity demanded increases, and vice versa.
Factors That Affect Demand
Several factors impact demand. These factors include consumer income, tastes and preferences, substitutes, and population or demographic changes.
Consumer Income
Changes in buyer income cause changes in demand. An increase in consumer income will shift the demand curve outward and to the right for a product or service as consumers have more discretionary and disposable income to spend on their desires and wants.
However, a decrease in consumer income encourages saving, and customers are less likely to spend. Therefore the demand curve shifts to the left inward as demand decreases for a particular good or service.
Tastes and Consumer Preferences
Changes in consumer shopping habits can create a shift in a demand curve and impact demand.
The demand curve will shift to the right if a product is fashionable. However, the demand curve will shift to the left if a product is no longer in style or fashion.
Substitutes
A substitute good is a product that can be used in place of another good as an alternative. An example would be an apple and a banana. When the price of a substitute increases, demand for a product increases.
Alternatively, when the demand for a substitute decreases, the price of the substitute for a particular good falls. For example: when the price of an apple increases, the demand for an orange increases.
Population and Demographic Changes
Changes in demographics can impact economic growth, living standards, and the structured growth of productivity within the economy. The greater the number of buyers in a market, the higher the demand for a product.
The Law of Demand
Based on the Demand Theory, the law of demand highlights a correlated relationship between the price of a good and the quantity demanded, where all factors are ceteris paribus and remain unchanged, excluding price.
The law of demand expresses that when the price of a good decreases, the quantity demanded of the commodity increases. Conversely, if the price of a product increases, the quantity of demanded goods decreases.
As indicated by the theory, there is an inverse relationship between price and quantity demanded in the law of demand, where all other factors are the same. Therefore, economists developed the function below to demonstrate the influences on the demand for a commodity:
Q = f(P, M, PR, N)
Where
- Q = Quantity purchased of a good or service
- P = Price of the good or service
- M = Consumers' income
- PR = Price(s) of related good(s)
- N = Number of buyers
It is important to note that there is a key difference between demand and quantity demanded in the Demand Theory. Demand refers to a relationship between price ranges and the quantity demanded at given price ranges. This is shown by a demand curve or a demanding schedule.
On the other hand, quantity demanded is a particular point on a demand curve or demand schedule, not at a given range. The quantity demanded is based on certain curve points, whereas demand is related to the entire curve.
Demand Theory assumptions
There are a few assumptions made according to the Demand Theory under the assumption of the law of demand where all factors except price remain equal; there are the following rules expressed as part of the Demand Theory:
- The price of a substitute commodity is unchanged
- The price of a complementary commodity is unchanged
- Buyer Income is unchanged
- Tastes and Preferences are unchanged
The theory also mentions the next aspect, which is the law of diminishing marginal utility. Marginal utility is the additional satisfaction a customer receives upon getting or utilizing a unit of product. Therefore it is the usefulness and value of a commodity.
The Law of Diminishing Marginal Utility implies that the satisfaction achieved for a customer is reduced when repeated purchases of the same product are made. Additional units of a product cause lower levels of satisfaction.
Income vs. Substitution Effect
The Income vs. Substitution Effect is another reason for the sloping downward trend of the demand curve. As the price of a commodity changes, there are two important effects on the consumer.
The first change is real consumer income since a consumer can buy more with the same amount of income, and the other is the price of a commodity changing in comparison to other products.
The substitution effect and the income effect help us understand why the demand curve is downward sloping and provide an economic explanation for the trend according to the Demand Theory.
The income effect results from real income changes with the given example that when the price increases, the buying power for a consumer is reduced, and they can not purchase as many units as before.
Therefore, a higher price means lower buying power, decreased sense of wealth, and less purchase of product units causing demand to decrease. The income effect can either be a net positive or a net negative.
The substitution effect includes substituting two alternate goods that serve the same purpose and have changes in price levels. When the price of a good increases, sales for the commodity will decrease, and customers will switch to the alternative instead.
For example, when the price of beef is increased, consumers will switch to eating chicken as an affordable alternative. The substitution effect is most effective when two commodities are close substitutes. An increase in the consumer’s buying power offsets the substitution effect.
Demand for A will decrease when prices increase and B is cheaper.
Individual vs. Market Demand
According to the Demand Theory, individual demand is described as the demand of an independent entity or a customer for the quantity demanded that would be bought at a specific time and price point.
Individual demand is based on a person’s ability to afford a particular good, and their desires are based on preferences and tastes that may adapt and change over time.
On the other hand, market demand focuses on demand by the entire community, where the total quantity of a product that all buyers of a commodity are willing to purchase over a certain period at a fixed price.
Unlike individual demand, market demand is determined by community expectations, tastes, preferences, and habits.
Market demand is scalable upon local, regional, and international in alignment with rapid innovation developments, market buyers, and community growth rate.
Individual demand is demonstrated by a demand schedule and demand curve, whereas market demand is portrayed by a market demand schedule and market demand curve.
Individual demand is a component of market demand, whereas market demand is the collective aggregation of individual demands.
The demand curve for individual demand is steeper, whereas the demand curve for market demand is flatter.
Individual demand has a narrower scope that is only related to tastes and preferences, but market demand has a broader scope that caters to all consumer tastes and preferences.
Lastly, a key difference between individual and market demand is that individual demand represents various amounts of a product at different market prices; market demand demonstrates multiple quantities of a good chosen by all customers at a range of prices in the market.
The Law of Demand and the Demand Curve
Under the Demand Theory, the graphical representations used are a demand curve and a demanding schedule.
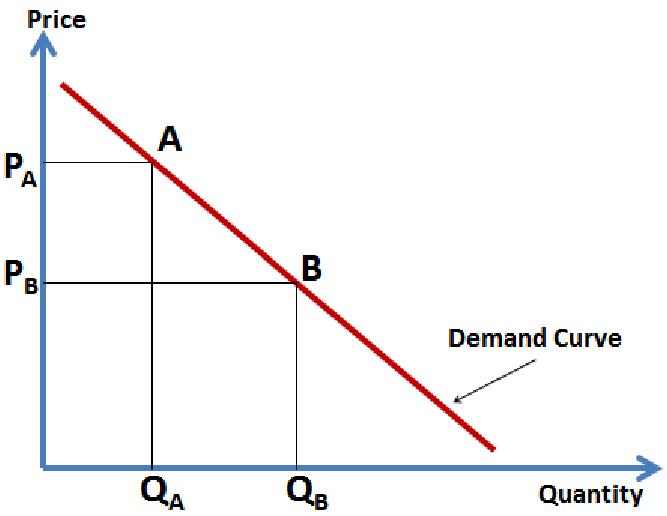
A demand curve is a curve that illustrates the functional relationship between both facts related to consumer demand and price by showing the responsiveness of quantity demanded to a change in price.
The demand curve is always downwards sloping due to the Law of Diminishing Marginal Utility, which will be discussed in more detail later in the article.
Expansion and Contraction of Demand
Movement along the Demand Curve is when the quantity demanded of a product is changed as a result of a change in price, ceteris paribus. Movement along a demand curve is either upward or downward.
An upward movement along a demand curve is a contraction of demand where the quantity demanded is decreased. Conversely, a downward movement along a demand curve is an expansion of demand where the quantity demanded is increased.
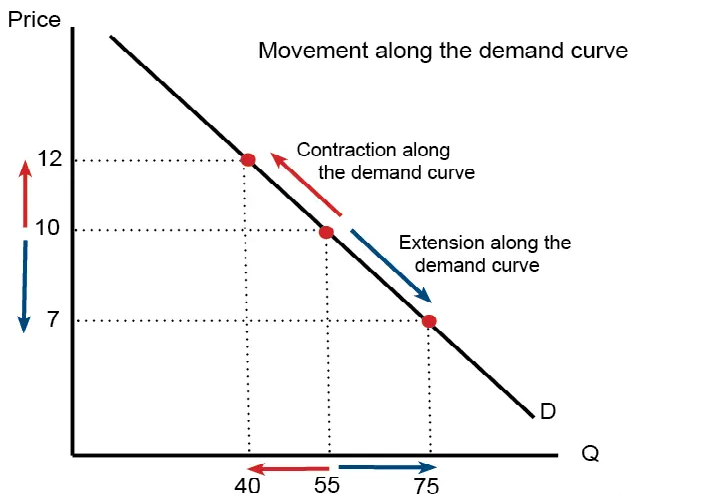
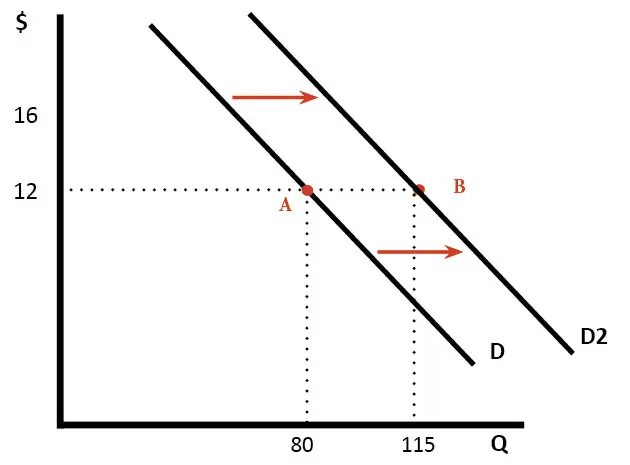
On the other hand, the opposite is evident when there is a shift in a demand curve. Under the Law of Demand, all factors except for the price of a product are constant and unchanged.
Change in Demand
A change in demand is shown on a demand curve when there are changes in a demand curve that are not due to price. Both demand curves and demand schedules are important components of the Demand Theory.
There are changes in a demand curve based on characteristics controlling demand, including substitute good prices, good complementary prices, buyer income changes, shifts in tastes and consumer preferences, demographic changes, income distribution changes, advertising, and government policies.
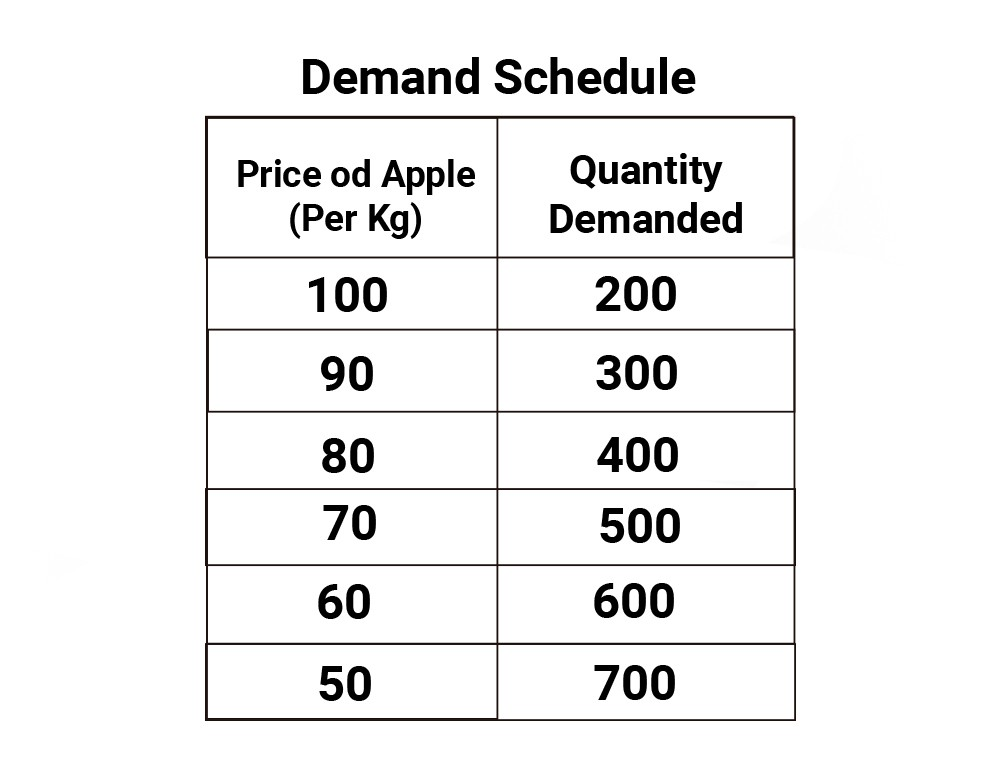
Demand Schedule
A demand schedule is a complete list of a range of quantities of a product that a consumer purchases at a range of prices within a market at a particular period.
However, within a market is a range of consumers having their demand schedule, which indicates the various quantities of a product that they can purchase at different price points.
A demand schedule is demonstrated as a demand curve that continuously moves on a chart where the X-axis indicates the quantity and the Y-axis illustrates the price.
It contains two columns where the first column indicates the price and the second showcases the quantity of a commodity.
The data that is input into a demanding schedule can be graphed and translated onto a demand curve where it presents itself as a visual demonstration of the correlation between both variables of demand price. Below is an example of a demanding schedule:
Price Elasticity of Demand
Concerning the Demand Theory, Price Elasticity of Demand, abbreviated as PED, is the responsiveness of quantity demanded to a change in price. It measures demand responsiveness.
It is an important concept used in understanding demand. PEDs are either elastic or inelastic.
When PED is elastic, a small change in price causes a disproportionate change in quantity demanded, whereas when PED is inelastic, a small change causes a minimal change in quantity demanded.
An example of an elastic good is an apple, whereas petroleum is an example of an inelastic good in Demand Theory.
The three types of Price Elasticity of Demand are:
- Price Elasticity of Demand
- Income Elasticity of Demand
- Cross Price Elasticity of Demand
- Price Elasticity of Demand: Measures the degree of change of demand for a product due to a price change. Commodities that are elastic have characteristics such as being luxury goods, expensive, several substitutes in a competitive market, and frequent purchases.
PED = Percentage Change in Quantity Demanded/ Percentage Change in Price
Inelastic products or those that have inelastic demand, have multiple substitutes, including petroleum, and they are essential products; they can be addictive and cost little with repeated purchases.
PED determinants include the number of close substitutes, how essential a product is as well as how much income is spent on a particular product.
In some instances, there can be price discrimination between products sold to various target groups. Women’s accessories are higher priced than men’s in fashion stores, for example.
Income Elasticity of Demand: Also known as IED, it is the degree of responsiveness of demand for a specific product against a change in buyer income.
- Cross-Price Elasticity of Demand: Cross-price elasticity of demand means the degree of responsiveness of demand for a commodity to the change in the price of its related goods (substitute goods or complementary goods).
Demand Theory FAQs
Luxury goods are non-essential and not necessary to have. They simply enhance an individual’s standard of living. However, when the price of a product increases, demand for the product also increases.
There is a disproportionate increase in consumer spending for luxury goods. Examples of luxury commodities are BMW cars, Chanel handbags, and Jo Malone fragrances.
These are inferior products which do not follow the Demand Theory and are named after Robert Giffen. Demand for a specific product reduces as price increases however, the opposite is true for Giffen goods.
An example of a Giffen good is the Irish potato famine that occurred in the 1800’s. As the prices of potatoes had increased, individuals reduced their costs and spending by purchasing less luxury products and instead bought a larger quantity of potatoes.


Free Resources
To continue learning and advancing your career, check out these additional helpful WSO resources:


or Want to Sign up with your social account?