J Curve
It is the line that begins to descend, then gradually rises, eventually climbing above the beginning position


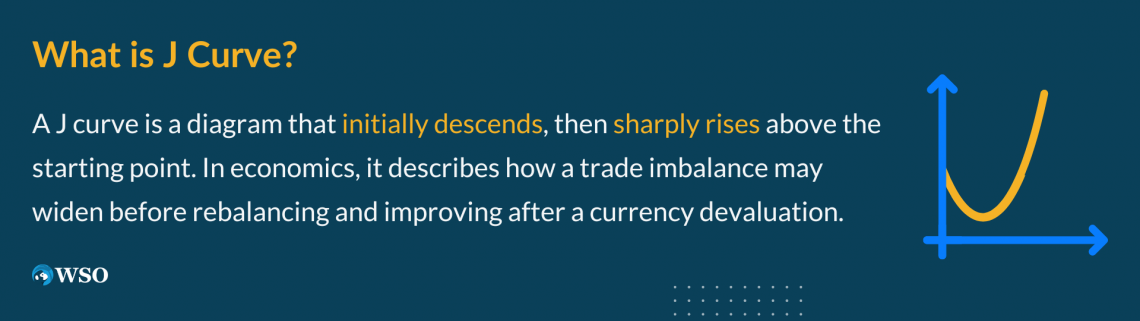
What Is A J Curve?
A J curve is any of several J-shaped diagrams in which the curve descends at first, then rises rapidly above the beginning point. For example, it is an economic hypothesis that states that after a currency devaluation, the trade imbalance will first widen but then slowly rebalance and rise.
With many curves and graphs, every economic theory gives a reasonable method for decision-making. But, it is incomplete without a graphical representation of economics, from the demand curve to the yield curve and all in between!
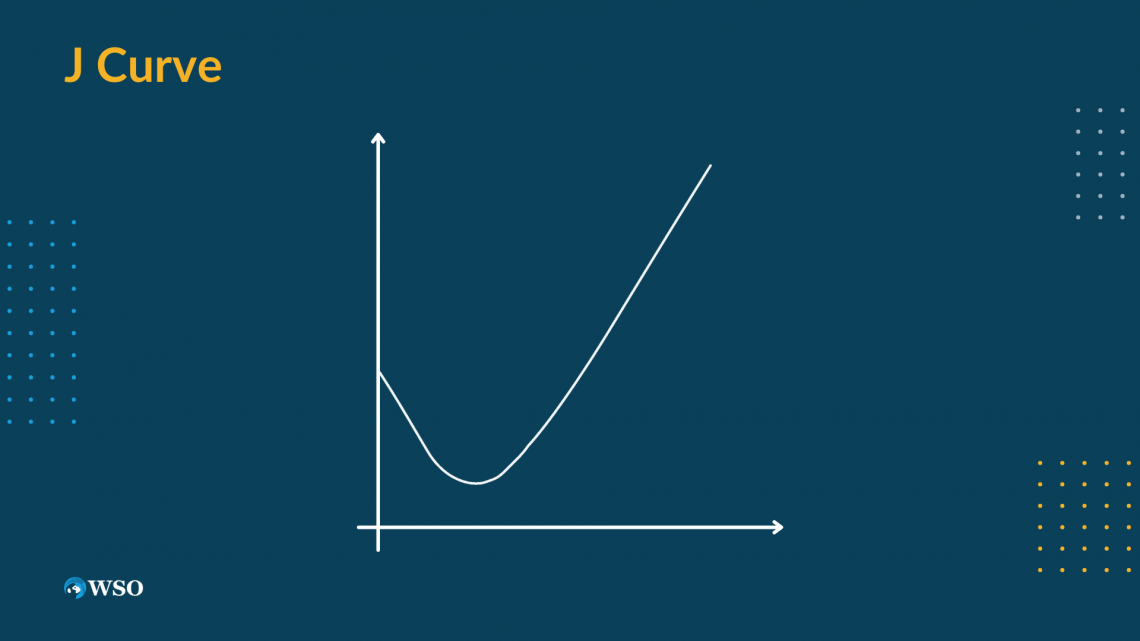
You've probably heard of the U-shaped curve. Similarly, the curve is formed like a J, as its name suggests. The line begins to descend, then gradually rises, eventually climbing above the beginning position.
It is an economic theory that asserts that, under certain assumptions, a country's trade deficit will initially deteriorate after its currency depreciates. This is mainly because higher import prices will significantly impact total nominal imports in the near term than decrease import demand.
When the nominal trade balance is shown as a line graph, it takes on the shape of the letter J. This is depicted below:
Because depreciation in a country's currency affects import prices, the imbalance will widen. Import prices will rise as the number of imports drops.
The curve also shows how the effect of increases in import prices will be bigger than the effect of reduced imports.
On the other hand, this move will positively impact the trade balance since it will result in an increase in exports and a decrease in imports. Moreover, aside from trade deficits, this idea may be applied to other fields such as private equity, medicine, and politics.
- The J curve represents initial worsening followed by significant improvement after currency devaluation in economics.
- It's used in private equity to show initial negative returns followed by increasing returns as investments mature.
- In the Country Status Model, it depicts the relationship between stability and openness of a state.
- The J curve concept applies in various real-world situations, explaining market reactions and patterns in different fields.
Understanding the J-Curve
It is based on the idea that microeconomic changes in trade volumes of imports and exports occur first, followed by price changes. Then, as time goes on, export quantities begin to skyrocket due to their more appealing prices to overseas purchasers.
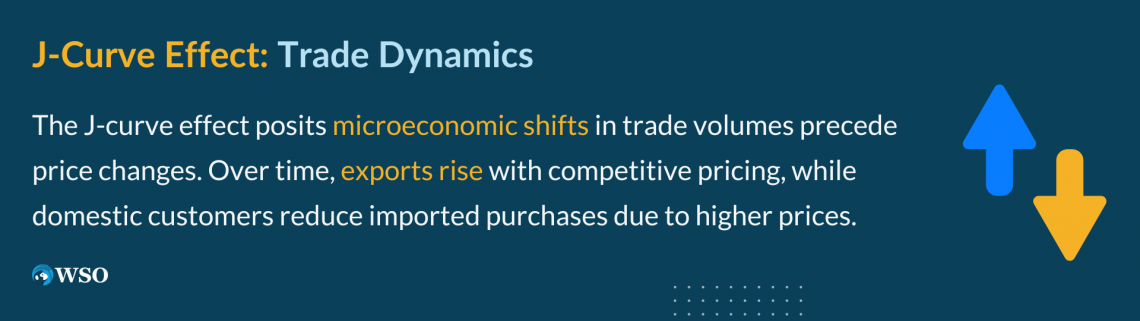
On the other hand, domestic customers buy fewer imported items due to their higher pricing.
The curves operate in the following phases:
- Initial loss: The period of negative return during which only investments are made, and there is no recoupment.
- Breakeven: The curve reaches a point at which the investment is equal during the breakeven phase.
- Dramatic gain: The phase where the curve surpasses the original investment quantity and enters the stage of absolute returns.
Compared to the data before the devaluation, these concurrent activities result in a higher surplus (or a smaller deficit) in the trade balance. Naturally, the same economic logic applies in the opposite scenario—when a country's currency appreciates, the J curve inverts.
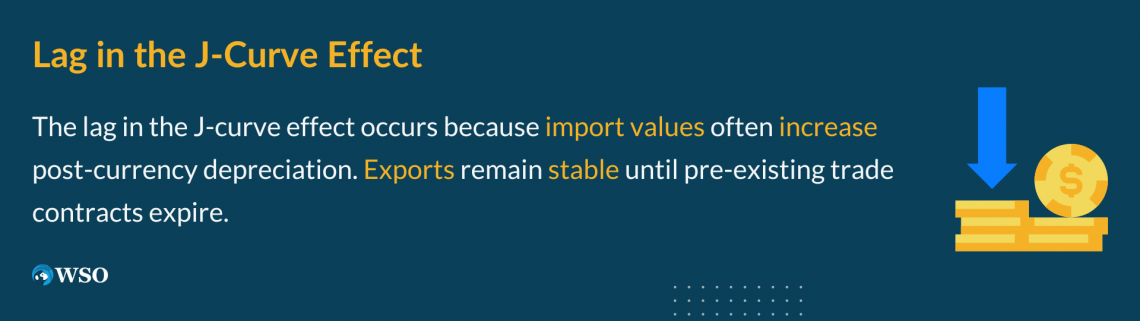
The lag between depreciation and reaction on the curve is mainly because the overall value of imports is likely to rise even after a country's currency depreciates. However, until the pre-existing trade contracts expire, the country's exports remain unchanged.
Over time, many foreign customers may increase their import purchases from the country with the depreciated currency.This is a phenomenon in which a country's trade balance deteriorates after its currency depreciates before improving.
In general, currency depreciation is supposed to enhance the economy's overall trade balance by stimulating exports while discouraging imports. However, this may not happen immediately because of other economic frictions.
For example, many importers and exporters in the nation may be bound by contracts that require them to buy or sell a set amount of commodities despite the currency's unfavorable exchange rate.
The J-Curve in Economics
It is a shift in a country's trade balance, commonly occurring after a currency devaluation or depreciation. For example, imports will be more expensive with a weak currency, but exporting goods will be in high demand.
The imbalance causes the trade balance to decline, resulting in a smaller surplus or a larger deficit.
There will be a lag in adjusting import consumption immediately following a currency depreciation. However, in the medium term, demand for high-priced imports and low-priced exports will remain unchanged as customers seek alternatives.
Currency depreciation or devaluation has the long-term effect of causing local customers to move to cheaper, locally-manufactured goods.
Furthermore, international merchants will buy more things sold in their country. Because of the weakening currency, things exported to their nation are relatively cheaper.
At this point, the country has achieved its goal of improving its current account balance. However, when a country's currency depreciates, the value of exports falls below the value of imports, forming a curve.
However, because importers and exporters have enforceable obligations to supply goods in the future, this approach does not always work.
As a result, even if the currency depreciates and foreign currency exchange rates fluctuate, exporters and importers will continue to conduct business as planned.
The overall value of imports will rise immediately after the currency is depreciated or devalued. Still, exports would generally stay unaltered, partly because of pre-existing trade agreements that must be upheld.
This is because import prices rise due to depreciation in the short run, and changing import consumption takes longer.
As a result, there is an initial increase followed by a delay until the long-run effects take control and consumers stop importing as many pricey goods, which, together with an increase in exports, causes the current account to widen (a smaller deficit or a bigger surplus).
Furthermore, demand for exports, which are less expensive to international purchasers using foreign currencies, and the more expensive imports are both price inelastic in the near term.
This is because the consumer's search for suitable, less expensive alternatives takes longer than expected (or they may not exist).
So, have you noticed how a variety of factors influences the curve? The influence of higher price elasticity, in the long run, is one of the most important variables to consider while comprehending the curve.
The J-Curve in Private Equity
In private equity, the curve depicts the propensity of private equity funds to record initial years of negative returns followed by subsequent years of increasing returns as the investments mature.
Investment charges, management fees, a failing investment portfolio written off in its early stages, and investment portfolios that have not yet reached maturity can all contribute to early negative investment returns.
Private equity firms typically wait until they've found lucrative assets before exerting their control of their investors' money.
The investors just agree to give money to the fund management as requested or as needed. Banks that lend to private equity firms negotiate for a cash flow sweep that mandates the fund to pay down its debt with some or all of the excess cash flow generated.
The private equity fund produces little to no cash flow for the investors in the early years; instead, the initial funds are used to lower the company's leverage.
This notion involves considerable financial modeling, with a financial analyst at a PE firm having to construct an LBO model for the acquisition.

The fund will first experience unrealized profits, followed by occasions in which the gains are realized if correctly managed.
Finally, increased returns to the fund are produced through:
- Leveraged IPOs
- Mergers, acquisitions
- Buyouts, which create the J curve's' form
First, the additional cash will pay down the debts; then, any extra cash will go to equity investors. The curve's inclination is controlled by the profits and how rapidly these gains travel back to the investors.
While a curve with a leisurely climb symbolizes a poorly managed private equity fund that took too long to realize gains and only created modest returns, a sharp curve shows a fund that achieved the largest returns in the shortest time.
The J-Curve in Country Status Model
The relationship between stability and openness is another "J curve." In his book "The J Curve: A New Way to Understand Why Nations Rise and Fall," author Ian Bremmer first put out this thesis.
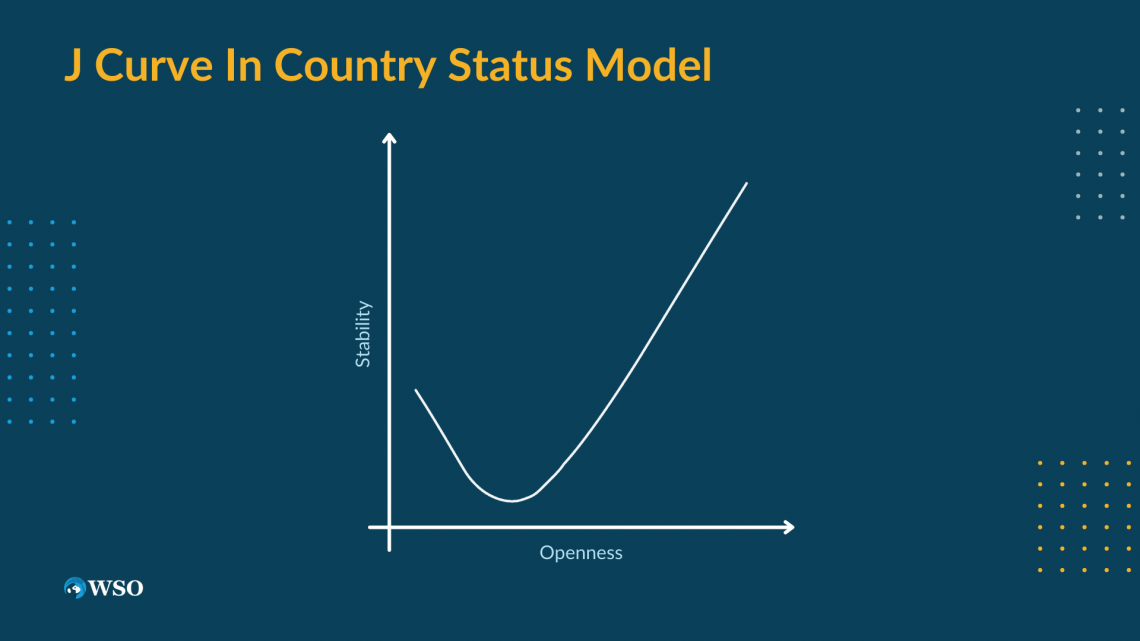
The 'openness' of the economy in question is represented by the x-axis of the political J curve graph, while the y-axis represents the stability of the same state.
As one moves right along the x-axis, it is evident that stability (for relatively short periods in the lengthy life of nations) decreases, creating a dip in the graph, before beginning to pick up again as a state's "openness" increases. This suggests that states that are "closed" are very stable.
The open states of the West, like the United States of America or the United Kingdom, are at the end of the curve opposite closed states. As a result, a J-shaped curve is created.
Stability and openness are never guaranteed since states can move either:
- Forward (right)
- Backward (left) along this curve
The curve is higher on the far right than the left because states that succeed in opening their societies—like Eastern Europe, for example—become more stable than authoritarian regimes.
The J is steeper on the left because it is easier for a leader in a failed state to create stability by closing the country than to build a civil society and establish accountable institutions.
Depending on the economic resources available to the relevant government, Bremmer's whole curve can shift upwards or downwards.
For example, the relative stability of Saudi Arabia at each point along the curve changes in response to changes in the price of oil, whereas China's curve changes in a similar way but in response to the yuan's relative value to the U.S. dollar.
Other uses of the J-Curve
These curves show how private equity firms often generate negative returns in the first few years following their establishment but start to see benefits as they mature. Because investment expenses and management fees first consume money, private equity funds may suffer early losses.
However, as funds mature, they manifest previously unrealized gains through events such as mergers and acquisitions (M&A), initial public offerings (IPOs), and leveraged recapitalization.
In general, any event that exhibits a strong reaction in the predicted direction after an initial counterintuitive response to a change might have a J shape when charted as a line graph. This graph is referred to as a J Curve.
These curves are commonly seen in graphs in the medical community. For example, the x-axis represents one of two potentially treatable disorders, such as blood pressure or cholesterol levels, and the y-axis represents the risk of a patient developing cardiovascular disease.
In some cases, an oil leak in an engine may increase oil pressure due to higher friction and heat brought on by the low oil level, followed by a bigger fall in oil pressure as more oil seeps out of the engine.

If engine oil pressure with time were to be charted, this would create a reverse J curve.
Political science has also used the theory.
James Chowning Davies, a renowned American sociologist, said that riots are a subjective reaction to a rapid turn in fortunes following a protracted period of economic prosperity, known as relative deprivation. He included the curve in models used to explain political upheavals.
For a real-world illustration of the curve, look no further than Japan in 2013. Following a sharp drop in the yen value, the country's trade balance declined, mostly because it took some time for the number of exports and imports to adjust to price signals.
To combat deflation, the Japanese government conducted significant currency purchases. However, due to energy imports and a lesser valued currency, the nation's trade deficit increased to 1.3 trillion yen (US$12.7 billion).
Conclusion
The J curve is a fantastic notion of understanding how initial losses don't matter when we tie our laces for the long haul since, in finance, everything revolves so much around a corporation's growth and future possibilities!
The curve illustrates a pattern that begins with a significant decline and concludes with a sharp ascent. The rise and fall of this unclear arc indicate the area's development under consideration.
The curve helps illustrate the outcomes of a situation or activity over a predetermined amount of time. Simply said, it illustrates that things will deteriorate before they improve.
We can conclude that:
- A J curve represents a trend that begins with a strong decline and is abruptly reversed
- The trendline's result is better than the starting point
In economics, the curve illustrates how a currency depreciation results in a significant worsening of a trade deficit followed by a significant improvement.
Economists point out that a reverse J curve might occur when a nation's currency increases in value. This is because the cost of the nation's exports to importing nations suddenly increases.
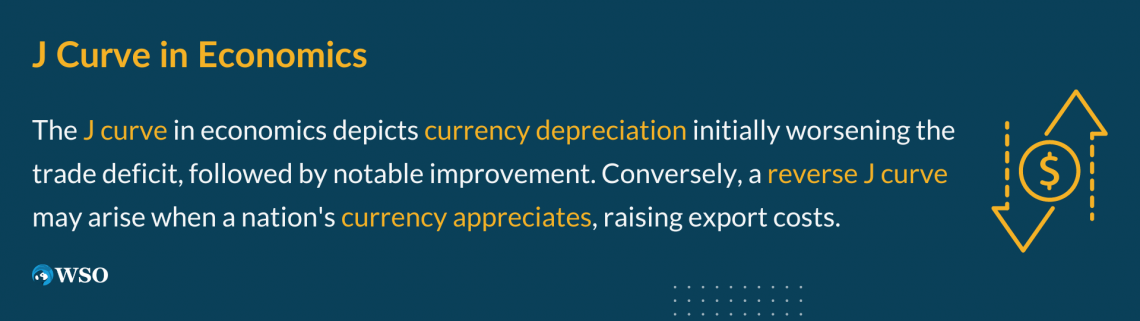
The higher-valued currency will make the nation less competitive in exports if other nations can meet the demand for the product at a lower price. Because imports become more competitive with locally made items, local customers may also move to them.
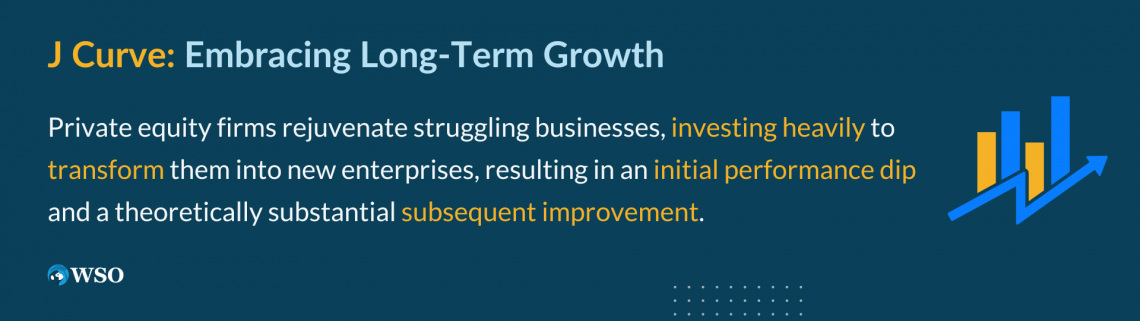
The typical trajectory of investments made by a private equity company is described as a "J curve." It is a graphic illustration of the simple truth that situations occasionally deteriorate before improving.
Private equity firms take a different route to profitability than public corporations or the funds that invest in them. By design, their portfolios include businesses that weren't doing well when purchased.
The corporation then invests a sizable sum of money in retooling the business before starting it as a new enterprise. This implies an initial performance drop, followed, at least theoretically, by a sharp improvement.
To reduce and/or minimize this period of poor returns for investors, there are three techniques to smooth out the curve:
- Invest in a business that assesses fees based on the capital deployed instead of money pledged.
- Invest in a corporation that prefers to buy strong, expanding companies over struggling ones.
- Invest using a mix of debt and private equity (often referred to as private capital) to produce both income and growth.


or Want to Sign up with your social account?