Fairly Valued Security
It is highly dependent on the cash flows the security generates


What is a Fairly Valued Security?
A security can be considered fairly valued when the ‘intrinsic value,’ i.e., the true value of the security, will be similar to the market value of the security.
The intrinsic value calculation is dependent on multiple variables and inputs. The same security can have different fair values depending on the input variables. Thus, there is no definite answer to the question of whether a particular security is fairly valued or not.
The market value and fair value of securities are not correlated to each other.
The textbook definition of the fair value of a security is the Present Value of the Future Cash Flows discounted back at an appropriate discount rate.
The fair value of any security is highly dependent on the cash flows the security generates, and then the cash flows are forecasted up to the foreseeable future and are discounted back at a discount rate that is appropriate for that specific security.
- Intrinsic value is determined by models like DCF and DDM, aiming for a value close to market value.
- Overvalued securities have market values higher than intrinsic values, while undervalued securities have intrinsic values higher than market values.
- DCF uses discounted future cash flows, and relative valuation compares multiples like P/E ratios within an industry.
- WACC, the average cost of all funding sources, is used as a discount rate and includes the cost of equity, debt, and preference shares.
What does Fair Value Tell us?
After using the right model on security (which we will be discussing below), if the estimations are correct, you will arrive at an intrinsic value estimate for the security.
The fair value is the true value of the security, which can be lower, higher, or similar to the current market value of the security.
Three estimates can be seen after the valuation:
If the security is overvalued in an absolute model, then it means that the security's current market value is more than the sum of the present value of all its future cash flows.
If the security looks overvalued in a relative model, the company is more expensive on specific metrics like P/E and P/B when compared with its peers.
It is preferable to avoid this type of security as it is trading at a premium from its intrinsic value, which is not sustainable in the long term.
Note
Analysts usually give a sell rating on overvalued firms.
2. Undervalued Security
If the intrinsic value, which is the sum of the PV of all future cash flows, is below the security's current trading price, then the security will be considered undervalued on an absolute basis.
In a relative valuation model, the stock will have cheaper valuation ratios than the industry or peer group. These securities have a buy rating as they are trading below their fair value. As the stock reaches its true value, there is potential for gain.
3. Fairly Valued Security
A fairly valued security is one in which the sum of PV of all future cash flows is equal to the current market value or when the valuation ratios are comparable to those of its industry or peer group. There is usually a buy or hold rating on fairly valued securities from brokerage houses.
Fair Valued Security Calculation Models
There are a lot of models built around the calculation and estimation of the intrinsic value of a security. Each model focuses on a specific aspect that it believes is the most appropriate metric to estimate the fair value of that particular security.
Some of the most popular models for fair value calculation are as follows:
-
Dividend Discount Model
-
Asset-Based Valuation
-
Relative Valuation
-
Calculating the Intrinsic Value of Options.
Discounted Cash Flow Model (DCF Model)
DCF is the most widely used and accepted valuation model. DCF uses “Free Cash Flow” for intrinsic value estimation.
Free Cash Flow (FCF) is cash that a company has left over after it has fulfilled its operating expenses and capital expenses (CapEx). Expenses such as rent, taxes, CapEx, and, at times, working capital are deducted to understand how much free cash flow a company has.
The Free Cash Flow can then be used to repay debt, pay out dividends, and invest in other growth opportunities. A high free cash flow is an indication of a well-managed, profitable company.
Free Cash Flow = Operating Cash Flow - Capital Expenditures
What Is Free Cash Flow to Firm (FCFF)?
FCFF is what remains after accounting for the working capital and long-term investments. FCFF takes shareholders and bondholders as beneficiaries as the interest expense is not deducted.
FCFF is usually preferred when the company has significant debt in its capital structure. It is discounted at the Weighted Average Cost of Capital (WACC) as it considers both equity & bondholders.
FCFF = Earnings Before Interest and Tax(EBIT) x (1 - Tax Rate) - Depreciation & Amortization - Long-term Inverstments - Investment in Working Capital
What Is Free Cash Flow to Equity (FCFE)?
FCFE is the cash flow available to a company’s common stockholder. After all, operating expenses and borrowing costs (principal + interest) have been paid, and necessary investments in working capital and long-term assets have been made.
FCFE is further used to pay dividends and reinvest into the business for growth. It will be discounted back at the Cost of Equity (Ke) because it does not consider bondholders, so the Cost of Debt (Kd) is ignored.
FCFE = Cash from operations − Capex + Net debt issued
Dividend Discount Model (DDM)
A dividend discount model states that the value of a stock is worth the sum of all its future dividend payments, discounted back to its present value. The discount rate used is the cost of equity (Ke).
The dividend discount model is preferably used on a mature company paying dividends to its total capacity. A preferable payout ratio would be around 40% - 50% of the net income.
The rationale for the DDM model is the same as the free cash flow model, where the present value of the expected cash flows discounted back is the intrinsic value of the security.
Formula:
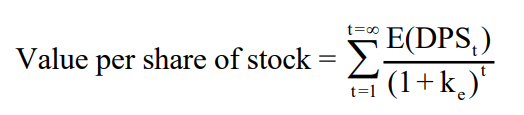
Where,
- DPSt = Expected dividends per share
- ke = Cost of equity
Several versions of the DDM have been developed to adjust for a major limitation of the DDM, which was the maturity of the company.
The updated models can be used on companies early in their corporate lifecycles as they have adjusted their equations to accommodate higher growth.
Gordon Growth Model (Constant Growth Model)
The Gordon growth model is used to value a firm that is in a more mature stage of its cycle.
One important assumption for the constant growth model is that the dividend growth rate can be sustained forever. Thus its use is limited to firms growing at a stable rate.
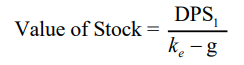
Where,
- DPS1 = Expected Dividends one year from now
- ke = Required rate of return for equity investors
- g = Growth rate in dividend forever
Two-Stage Dividend Discount Model
As the name suggests, 2-Stage DDM allows for two stages of growth.
An initial stage is usually the unstable growth phase of the business, where the growth can be negative as well, and the second stage is where the growth rate stabilizes and is assumed constant up until perpetuity.
The initial stage usually has a higher growth rate than the second stage, but the model is flexible to adjust for lower or negative growth rates.
The value of the stock in the model will be the present value of all dividends during the initial stage plus a terminal value.
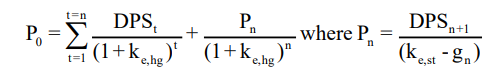
Where,
- DPSt = Expected dividends per share in year t
- ke = Cost of Equity
- Pn = Price at the end of year n
- g = Extraordinary growth rate for first n years
- gn = Steady state growth rate forever after year n
Three-Stage Dividend Discount Model
The three-stage model has the most variables of all the DDM models, as it accounts for three stages of growth within the firm.
The initial stage is the unstable growth phase, where like the 2-stage model, negative growth can be accounted for.
The second stage is where the dividends are still growing but at a slower rate than the initial stage. The final stage is the same as other DDM models, where a constant growth rate is assumed until perpetuity.
This model's flexibility makes it so that it can be used on any firm, but as it encompasses the majority of the corporate lifecycle of a firm, it is best used for a firm at the very initial stage of its lifecycle.
Refer to Ashwath Damodaran's Paper on DDM for more information.
Asset-Based Valuation
An asset-based valuation is derived by subtracting a company's liabilities from its total assets (TA). The assets are to be valued at a fair market value.
This is also known as the liquidation value method. A major drawback of asset-based fair value estimation is that the model does not incorporate growth into its calculations, so the intrinsic value estimates are on the lower side.
The asset-based valuation method essentially uses Book Value as the fair value of the security, which is what remains after subtracting liabilities from total assets.
Another drawback of an asset-based valuation is that it does not show the true intrinsic value of asset-light firms. It is an outdated valuation method majorly used during the liquidation process.
Instrinsic Value = (Sum of a company's asset, both tangible and intangible) - (Sum of a company's liabilities)
Example
The following data is from Berkshire Hathaway's 2021 FORM 10K.
(Figures in Million $)
| Total Assets (TA) | $958,784 |
| Total Liabilities (TL) | $443,854 |
| [Total Assets - Total Liabilities] | $514,930 |
Using the asset-based valuation method, the Intrinsic Value of BRK-A is $514,930 Million, or $514 Billion.
When compared with the market value of $771 Billion, Berkshire Hathway is overvalued in an asset-based model.
Relative Valuation
The relative valuation model is different from the absolute valuation model. It is unique in the sense that it does not give any importance to the present value of cash flows like the DDM and free cash flow models.
Instead, relative valuation models compare multiples of the security within its sector, industry, peer group, or directly to a specific competitor.
The relative valuation models are based on specific ratios. The most popular ratios used in relative valuation models are Price-to-earnings (P/E), Price-to-book value (P/B), Enterprise Value/Earnings before depreciation, interest, and tax (EV/EBITDA), and Price-to-sales (P/S).
An advantage of this valuation method is that it is much less time-consuming, and at the same time, it gives a fair idea of whether the firm is overvalued, undervalued, or fairly valued compared with its peers.
Example
The stock of The Coca-Cola Company (TICKER: KO) is trading at $62.86 on the NYSE, and TTM EPS is $2.37 per share [as of May 24th, 2022]. The P/E ratio is calculated by dividing $62.86 by $2.37, which comes to 26.52 times.
The stock of PepsiCo Inc. (TICKER: PEP) is trading at $165.6, and the TTM EPS is $7.31 per share [as of May 24th, 2022]. The P/E ratio comes at 22.65.
So by comparing the P/E ratios of both companies, we can conclude that PepsiCo is undervalued while Coca-Cola is overvalued.
The relative valuation method can also be used on unlisted companies, which can be compared to the valuations of their publicly listed peers, and a valuation can be assigned to the unlisted firm on a comparative basis.
One limitation of the relative valuation method is that it only works on comparable companies like in the above example, where KO and PEP have similar product market share, cost structures, and business verticals.
At times firms in a similar sector have different cost structures and vertices; at that time, the relative valuation is not as effective.
What Is the Cost of Capital?
Cost of Capital is the minimum return a company needs before undertaking a project. The cost of capital can also be looked at as the opportunity cost of funds for the suppliers of capital.
The cost of capital is used by investors and analysts as a discount rate in absolute valuation models to calculate the present value of the firm's future cash flows.
A company typically has several alternative sources such as equity, debt, and hybrid instruments like preference shares to raise capital.
Each of these alternatives has its own specific cost attached to it, e.g., the cost of debt (Kd) will be the interest payments & the cost of preference shares will be the preference dividend paid to the shareholders.
The weighted average of the costs of capital of all the funding sources of a firm is the weighted average cost of capital (WACC). The WACC is the most appropriate discount rate.
Example: Capital Structure of XYZ Ltd.
| Capital Sources | Weight | Cost of Capital |
|---|---|---|
| Equity | 50% | 8% |
| Debt | 30% | 3% |
| Preference Shares | 20% | 5% |
The WACC for XYZ Ltd. will be:
[(.5*.08)+(.3*.03)+(.2*.05)] = 5.9%
There are three types of cost of capital Equity, Debt, and Preferred:
1. Cost of Equity (Ke)
The cost of equity is the rate of return demanded by equity investors. Ke is the trickiest cost to figure out as the cost is not as well defined as interest or preferred dividend payments. Equity capital is the most expensive capital to use, so the Ke is always the highest in a company’s capital structure.
There are a few models and formulas to determine the Ke of a firm, but the Capital Asset Pricing Model (CAPM) is the most widely accepted.
Formula:
E(Ri) = RF + ßi [E(RM) - RF]
Where,
- ßi = the return sensitivity of stock i to changes in the market return
- E(RM) = the expected return on the market
- E(RM) - RF = the expected market risk premium
ßi or beta is used as an estimation of risk in the CAPM, and the beta is the public company's stock beta. Beta can also be estimated for unlisted firms using the average beta of their listed peer groups.
The advantage of the CAPM is its flexibility to adapt to private firms and simplicity.
2. Cost of Debt (Kd)
The cost of debt is the interest payments on the firm's total debt obligation, but the interest component is also tax-deductible while calculating Kd.
Example:
| Total Debt | $100,000 |
|---|---|
| Interest | $5,000 |
| Tax | 35% |
Kd = (5000/100000)*(1-.35)
Kd = 3.25%
The cost of debt is usually the cheapest form of capital for the company as the interest expense is always lower and the added advantage of the tax deduction makes Kd the least expensive.
Mature asset-heavy companies usually have a high percentage of debt in their capital structure as they have a lot of assets to pledge with long and profitable operating history.
3. Preference Shares
-
Preference shares are a hybrid instrument having the properties of both equity and debt.
-
Preferred shareholders get a fixed dividend, usually at a higher rate than the interest rate, and that preference dividend is the cost of capital for the preferred shareholders.
-
Preference shares can also have a convertible option where at the end of the period, they can be converted into equity shares at a pre-defined ratio.
-
Preference shares usually do not have much weightage in a company's capital structure.
What does Free Cash Flow tell us?
By definition, free cash flow is the cash left after the firm has fulfilled its operational and capital expenses. It can tell us much about a company's financial health, strategic position, and corporate life cycle.
Free cash flow, like any other metric, should not be examined on a standalone basis as it has many variables that can impact its interpretation.
A firm that is free cash flow positive can be interpreted as a mature firm with limited Capex and operational requirements. It can also be interpreted as a cash cow firm that, even after fulfilling its extensive Opex and Capex, still holds onto very large amounts of cash.
Growth in free cash flows can also happen if a company decides to reduce its CapEx spending, which would positively affect cash flow but jeopardize the firm's growth in the longer term.
Negative or lower free cash flow is usually viewed as unfavorable, but it all depends upon the management's vision and the firm's strategic positioning.
For example, a younger firm in a high-growth industry will have significant debt and CapEx requirements, which will increase operating and capital expenditures. This is necessary for the business's growth, but it will poorly impact free cash flows.
Negative free cash flows usually suggest that the firm is investing a portion of its earnings back into the business.
Advantages of fairly valued security
The advantages of a fairly valued security can be seen as:
- Accurate pricing: Accurate and practical evaluations of a company's value that take into account both market conditions and inherent value are reflected in fairly priced securities.
- Stability of investments: Since properly valued securities' market price corresponds with their genuine value, investors should anticipate less volatility and a lower likelihood of large price corrections.
- Making Well-Informed Decisions: Gives investors a strong foundation on which to make investment decisions and guarantees that they purchase or hold appropriately priced assets.
- Market Effectiveness: It ensures that prices accurately reflect all available information and basic values, which enhances the overall efficiency of the financial markets.
- Proper Risk and Return Balance: It usually attracts cautious investors looking for steady growth since it offers a risk-return profile that is balanced.
Disadvantages Of Fairly Valued Security
The disadvantages of a fairly valued security are:
- Restricted Possibility of Gain: Since fairly valued stocks are already priced appropriately, there is less chance that they will appreciate much, which could restrict their potential short-term gains.
- Opportunity Cost: Missed opportunities to invest in undervalued securities with higher prospective returns may arise from purchasing adequately valued equities.
- Risk of Market Perception: The price of assets that are appropriately valued can still be influenced by external circumstances and market views, which could result in a brief mispricing.
- Intricate Process of Valuation: It takes extensive and time-consuming research to determine if an investment is reasonably valued, and ordinary investors may not always have access to this kind of information.
- Changing Market Conditions: In a market that is changing quickly, fair value evaluations are dependent on assumptions and current facts, which can quickly become out of date and result in potential mis-valuations.
Conclusion
Securities that exhibit a high degree of market price alignment with their intrinsic values, as determined by practical valuation models such as the Dividend Discount Model (DDM) and the Discounted Cash Flow (DCF), are considered fairly priced.
The stable alignment of these investments minimises volatility and the likelihood of substantial price corrections, thereby attracting conservative investors who prioritise consistent growth and a well-balanced risk-return profile.
Furthermore, because properly valued securities accurately reflect all relevant information and basic values, they enhance market efficiency.
However, because these products are already priced adequately, there isn't much room for significant short-term profits. This can result in lost chances to profit more from discounted securities and increase returns.
Furthermore, figuring out fair value is difficult and time-consuming; it involves a lot of data and research that regular investors might not have access to.
The prices of correctly valued securities are nonetheless susceptible to external influences and market perceptions, which may result in transient mispricing.
Market conditions that are changing quickly might also make fair value evaluations antiquated, which could lead to mis-valuations.

Free Resources
To continue learning and advancing your career, check out these additional helpful WSO resources:


or Want to Sign up with your social account?