Nominal GDP vs. Real GDP
The prior refers to the total value of all the goods and services produced in an economy at current prices. And, the latter is the total amount of goods and services produced in an economy at adjusted prices.


What is Nominal vs. Real Gross Domestic Product (GDP)?
Nominal GDP is the total value of all the goods and services produced in an economy at current prices. The Real GDP is the total amount of goods and services produced in an economy at adjusted prices for inflation or deflation.
When looking at GDP, it is most common to look at real GDP instead of nominal GDP. This is because the former is adjusted for inflation and better captures changes in economic output concerning purchasing power.
To calculate real GDP, we must consider a couple of steps:
- It is an adjusted version of nominal GDP. Therefore we must first calculate the nominal GDP. There are a couple of methods to do this.
- We can calculate inflation rates by comparing a price index and measuring changes in the price level over time.
- Using our understanding of inflation and price level changes, we can create a deflator to adjust nominal GDP.
- This leaves us with Real GDP, an important indicator for economics and finance.
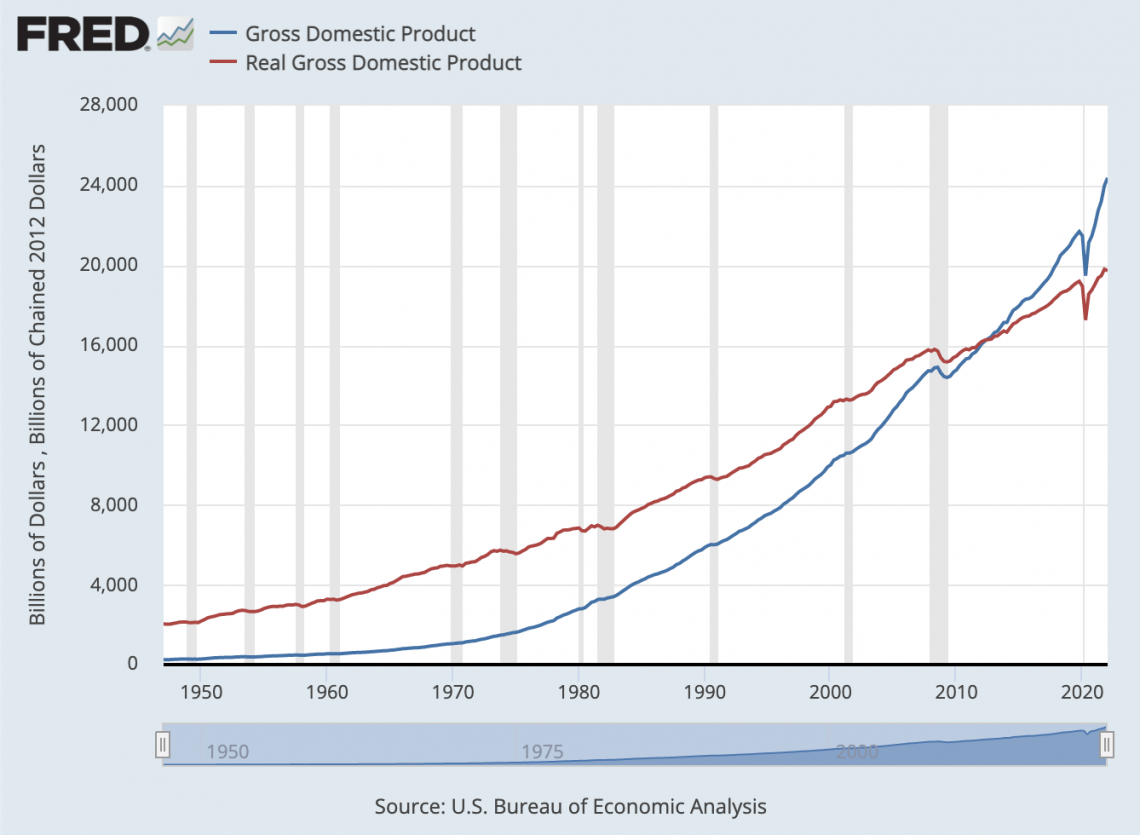
Because it is simply an inflation-adjusted version of nominal GDP, there exists a point when they intersect. In the case of the graph, this is in 2012. This is because the dollars are adjusted to match the purchasing power of the US dollar in 2012.
- Nominal GDP measures the total value of all goods and services produced in an economy at current prices during a specific time period. It does not adjust for inflation or deflation.
- Real GDP measures the total value of all goods and services produced in an economy, adjusted for changes in price levels (inflation or deflation), using constant prices from a base year.
- Nominal GDP provides a snapshot of the economy’s size and output at current price levels, useful for understanding the immediate economic situation.
- Real GDP provides a more accurate measure of economic growth by adjusting for inflation, allowing for comparisons over different time periods.
How is Nominal GDP Calculated?
There are a few different ways to approach measuring nominal GDP. The following is a summary of how these three approaches (production, expenditure, and income) calculate GDP:
- The production approach calculates GDP by finding the total dollar amount of all goods and services produced.
- The expenditure approach calculates GDP by finding purchasers’ total dollar amount spent on all goods and services.
- The income approach calculates GDP by finding the total dollar amount of all income earned while producing these goods and services.
The fundamental identity of national income accounting is that the three of these should be equal. That is:
Total Expenditure = Total Income = Total Production
Although, in theory, all three of these methods can be used, it is, in fact, most common for economists to calculate gross domestic product by using the expenditure approach.
This is because it allows for analysis of the individual components included in the expenditure approach.
By looking at the gross domestic product from a perspective that tracks several different components, government fiscal policy and central bank monetary policy impacts are easily analyzed from a gross domestic product standpoint.
The Production Approach
From a production standpoint, the definition of nominal GDP is the current market value of all final goods and services produced domestically in the economy within a certain period. This definition is quite specific, ensuring that the calculation is always consistent.
Because the gross domestic product is defined as the “market value” of the goods, it allows for easy calculation – goods and services are included in the GDP at their market sale price.
Because some goods do not have a market price, they are added as imputed values (approximate estimates of the market value).
Clarifying “final goods and services” ensures that nothing is double-counted. Final goods and services are defined as those sold for final use and not utilized in the production process.
For example, if both the components used to build a computer and the computer were counted in GDP, those components would be counted twice.
Instead, we calculate the final value by excluding intermediate goods and services or by only factoring in value-added at each step, automatically subtracting intermediate goods from the total.
The “newly produced” specification ensures that only goods produced in that period are included in the GDP calculation. For example, a good manufactured in 2019 and sold in 2020 would count toward 2019 GDP.
The gross domestic product definition also includes the technicality of “domestically produced.” This means that only products within the geographical boundaries of the country in question are counted.
Finally, “within a certain period” clarifies that GDP represents a certain economic output amount spanning over a period of time rather than at one moment.
The Expenditure Approach
In terms of expenditure, gross domestic product is the total dollar amount of spending on final goods and services produced domestically during a given period. This definition has the same caveats as the production approach.
We consider the main expenditure categories to calculate GDP from an expenditure perspective. These include:
- Consumption (C)
- Investment (I)
- Government purchases (G)
- Net exports (NX)
Together, these four components form the national income identity, where Y represents GDP.
Y = C + I + G + NX
The category of consumption includes spending on goods and services by households. This can be broken into the subcategories of consumer durable goods, nondurable goods, and services.
The investment category focuses on spending for capital goods (which are treated as fixed investments) and inventory expenditure. This further breaks down into residential, nonresidential, and inventory investments.
The government purchases section is essentially the equivalent of the consumption category but details government spending rather than household expenditure. Government purchases include those by the Federal government, State governments, and local governments.
Government transfer payments are not included in the government section of GDP, as nothing is exchanged in return for government payments. In other words, the government is not actually purchasing anything.
The net export category focuses on the net change in the gross domestic product due to imports and exports. Exports are domestic goods purchased internationally, and imports are foreign goods purchased by domestic residents. We calculate net exports with the equation:
Net Exports = Exports - Imports
Together all these components are added to form nominal GDP, as described in the national income identity.
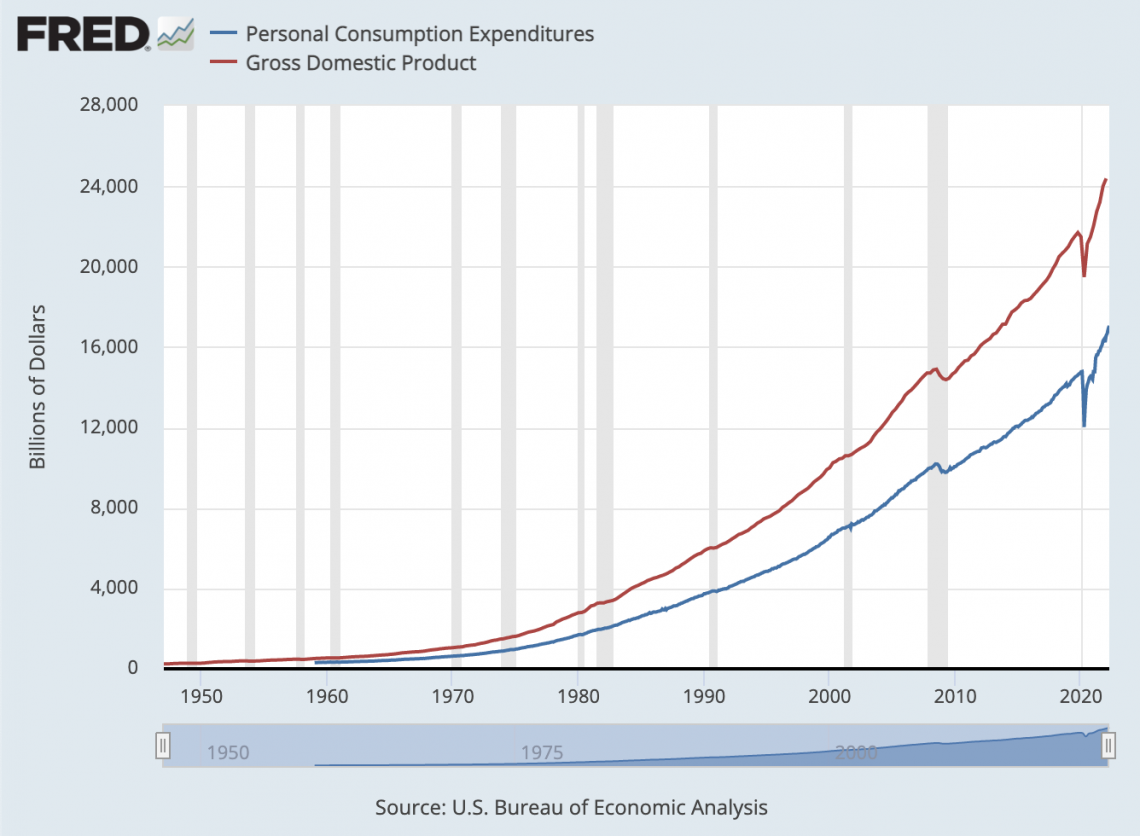
Approaching income from an expenditure perspective is pretty common, as it allows us to see which factors contribute the most to the gross domestic product. In the United States, for example, consumption makes up a large percentage of GDP, as we can see from the graph.
The Income Approach
From an income perspective, the definition of nominal gross domestic product is the total dollar amount of income earned by individuals and businesses in the domestic economy.
There are a series of measures we can look at regarding income during the process of calculating GDP. These include:
National Income = Compensation for Employees + Other Income + Corporate Profits
Gross National Product = National Income + Depreciation
Gross Domestic Product = Gross National Product + Net Factor Income
As we can see, these three measures include variable amounts of the five income categories.
National income includes three types of income. These are employee compensation, other income, and corporate profits.
The gross national product includes four types of income. These are employee compensation, other income, corporate profits, and depreciation. As we see above, this is equivalent to national income, adding depreciation.
The gross domestic product includes all five categories. These include employee compensation, other income, corporate profits, depreciation, and net factor income.
(Net factor income reconciles the changes in income from people working abroad but sending money into the domestic economy and people working domestically sending money abroad).
As expressed above, this is also the same as the sum of gross national product and net factor income.
Understanding Inflation
Inflation is the loss of purchasing power of money over time. One dollar will always be one dollar; however, how much you can purchase with that one dollar can change. This change is the essence of inflation.
Inflation is measured as a percent change in the average price of a specified basket of goods, called the price level.
A common measure of inflation is the consumer price index (CPI), which is a basket of goods deemed typical of consumption. This is based on consumer expenditure surveys.
We can calculate the annual inflation rate using the following formula, where price level 1 is the current CPI measurement and price level 0 is the CPI measurement of the previous year:
[Price Level (1) - Price Level (0)]/ Price Level (0)
For example, if last year the CPI was 100 and this year it is 105, our equation would be the following:
(105 - 100) / 100 = 0.05
The decimal result of .05 would mean that we have 5% inflation.
Using our understanding of inflation, it becomes clear why we have an inflation-adjusted measure of GDP, real GDP. This is to reconcile changes in purchasing power in the economy.
Even if economic output increases by 5%, a 5% increase in price would eradicate any benefits.
Adjusting for Inflation
Now that we have a value for nominal GDP, we can adjust for inflation to get real GDP. We do this by using a deflator, which is found by the difference between price levels in the base year (the year we are comparing to) and the current year.
To calculate, we use the following relationship:
Real GDP = Nominal GDP / Deflator
Continuing our example earlier, we found an inflation rate of 5%, the difference in price levels. Instead of calculating the annual inflation rate, we can calculate the deflator by dividing the price levels.
Deflator = Price Level(1) / Price Level(0)
In this case, 105/100 would give us 1.05, which we would use to adjust nominal GDP.
As we can see, the deflator itself is incorporating the 5% inflation rate. In a situation where the price levels were the exact same, the deflator would be 1. Instead, the deflator is 1.05, a 5% increase from 1.
How is Real GDP Calculated?
Real GDP is a commonly referred to indicator in the field of economics. Gross domestic product is looked upon as the key measure of an economy’s healthiness from a production standpoint.
Changes in real GDP from one year to the next are tracked to determine the economy’s strength. For this reason, real GDP growth, along with changes in inflation and unemployment, form the basis for both fiscal and monetary policy.
GDP growth is calculated as a percent change in GDP, typically expressed annually. It can be calculated much like inflation, with the following formula:
[GDP(1) - GDP(0)] / GDP(0)
GDP growth can also be calculated quarterly; two consecutive quarters of declining GDP are considered a recession.
A decline in real GDP is usually associated with a decrease in employment and lower inflation rates. Conversely, an increase typically means rising employment and inflation rates.
For policymakers, monitoring this is helpful in conjunction with inflation and unemployment.
For example, if real GDP growth has risen above a stable level, inflation may worry about inflation. This may cause policymakers to raise interest rates.
On the other hand, if it is harmful and policymakers fear rising unemployment, they may lower interest rates to stimulate the economy and help employment rise.
GDP's Impact on Financial Markets
Since GDP measures economic activity, it is clear why it has important implications in the financial world as well. If the economic outlook is not looking positive, then the profitability of corporations would likely be lower as well.
For this reason, we expect equity prices to reflect changes in real GDP and the economy.
Investors, therefore, also closely monitor the gross domestic product. However, while investors care about real GDP, it would be a mistake to say that it is actually what affects the day-to-day price fluctuations in the stock market.
Data on gross domestic product is released quarterly by the Bureau of Economic Analysis, long after the quarter has ended.
Specifically, the advance release comes four weeks after the end of the quarter. The final confirmed number does not get confirmed until three months after the end of the quarter, meaning another whole quarter has passed.
For anyone making time-sensitive investment decisions, forecasting GDP and looking at other indicators will likely be a more effective strategy than waiting for data release simply confirming the actual GDP numbers.
Investors use another way GDP impacts decision-making with a ratio called the total market capitalization to GDP ratio. Different countries’ total market cap to GDP ratios are vastly different when compared to each other.
Because of the country-to-country differences, the ratio is useful only when compared to the historical data of the company that is being analyzed.
A ratio that is higher than its historical average would indicate that the total market capitalization of equities is overvalued. For some investors, this may lead to the decision to sell.
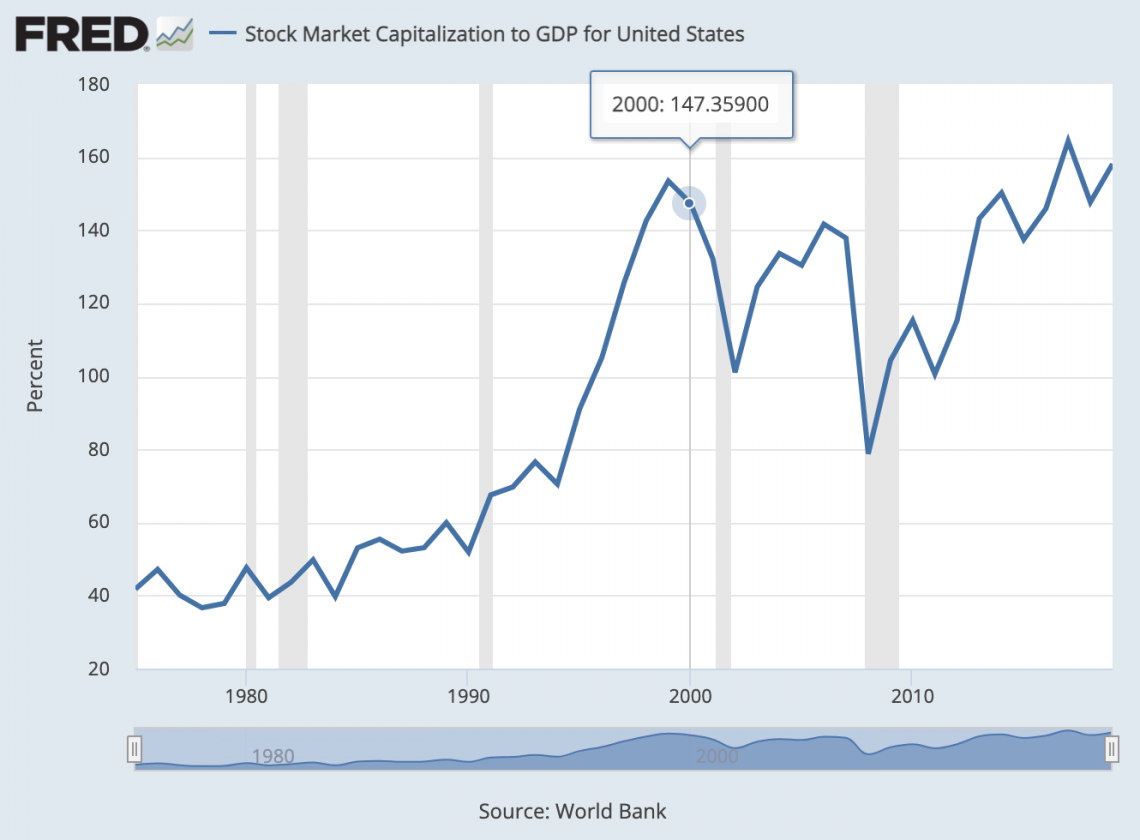
This graph exemplifies this exact situation. We can see that the market cap to GDP ratio is quite high compared to the last 40 years. Some investors may consider this a sign of a recession in the near future.
Graphs in this article can easily be replicated by taking Federal Reserve Economic Data (FRED) and using excel. Learning how to take data and create graphs is useful for most economics and finance professionals. Feel free to check out our Excel course if you’re interested in learning.


Free Resources
To continue learning and advancing your career, check out these additional helpful WSO resources:


or Want to Sign up with your social account?