Golden Cross
A bullish technical indicator formed on the chart corresponding to a short-term moving average rising above a longer-term moving average.


What Is a Golden Cross?
A Golden Cross (GC) is a bullish technical indicator formed on the chart corresponding to a short-term moving average rising above a longer-term moving average. Bullish chart patterns such as the GC often signal the beginning of sustained uptrends.
Whenever a security's short-term moving average crosses over its long-term moving average (such as its 200-day moving average) or a level of resistance, this pattern is referred to as a bullish breakout.
In technical analysis, it occurs when a shorter-term moving average rises above a longer-term moving average. It's a reliable positive price direction that complements most tradable assets.
Two crucial parts of this pattern as a trading method exist. These are:
- 200-day moving average
- 50-day moving average
In addition to the 200-day MA, the 50-day MA is regarded as one of the leading moving averages.
In contrast to the bullish price action shown by the GC, a death cross indicates a downward trend. However, when used in conjunction with other technical methods, these crossovers may be lucrative when trading.
In the stock market, they do not always portend a period of rising prices. In his role at Oppenheimer & Co., Ari Wald oversees the firm's technical analysis department.
Despite popular belief, he does not consider it an unquestionably bullish indication. In contrast, he argues, "All major rallies begin with a GC, but not all GC leads to a huge rally."
- A Golden Cross is a bullish technical indicator that occurs when a short-term moving average crosses above a long-term moving average. It typically signals the potential for a strong upward trend in the price of an asset.
- The most common moving averages used to identify a Golden Cross are the 50-day and the 200-day moving averages. The crossing of these two lines is considered a significant event by technical analysts.
- The formation of a Golden Cross is seen as a strong bullish signal, indicating a shift from a bearish market sentiment to a bullish one. Investors often interpret it as a sign to buy or hold onto their positions.
- Analysts often look for an increase in trading volume to confirm the validity of a Golden Cross. Higher trading volume at the time of the crossover can reinforce the bullish signal and indicate stronger market momentum.
The Three Stages Of Golden Cross
This Crossover has three distinct phases.
- The first phase of a golden cross is characterized by buyers outpacing sellers, indicating that the downtrend may be coming to an end.
- In the second phase, the trend reverses, and the market begins to move upwards, with the long-term moving average (MA) crossing above the short-term MA.
- In the third phase, the market continues to trend upwards, with the long-term MA remaining above the short-term MA. This is considered a bullish signal, indicating that the market will continue to rise.
Then, a new upward trend develops. Finally, a fresh uptrend begins when the short-term average rises above the longer-term average.
Lastly, the current upswing is sustained, with more increases substantiating a bull market. Therefore, whenever a corrective decline occurs during this period, the two moving averages that make up the GC should function as support levels.
More extensive periods are associated with more robust, long-lasting outbreaks. One of the most well-known bullish market signs is when an index's daily 50-day moving average rises above its 200-day moving average.
NOTE
Bull markets need both price and the 50-day moving average to stay healthy and above the 200-day moving average.
Intraday crossover breakouts are often traded by day traders using shorter time frames, such as the 5-period and 15-period moving averages. The charts' time is also customizable, from one minute to many weeks or months.
A bullish indicator, this cross, may be seen in various situations. If so, why? The concept is straightforward. We all know that a moving average plots the average value of an item over the period you choose.
Having a shorter MA below a longer MA indicates that recent market movement has been less bullish than recent price action over more extended time frames.
And what happens when the short-term average rises above the long-term average? In the short run, prices tend to rise above their long-term standards.
This signals an optimistic reassessment of the market's direction because it suggests that the trend may change.
NOTE
“According to the standard definition, it occurs when the 50-day MA rises over the 200-day MA. Nonetheless, the concept of the GC is based on crossing a short-term moving average over a long-term one.”
This means it may occur in other historical periods (15-minute, 1-hour, 4-hour, etc.). However, signals from more extended time frames are often more trustworthy than those from shorter ones.
What is the Moving Average?
The moving average is a popular technical analysis tool for calculating an average price over a specific time for a given asset.
The moving average is a line drawn on a price chart used to determine an asset's average price over a certain period.
When doing technical analysis on stocks, a moving average (MA) is often used as a tool for smoothing out price data by using a dynamically calculated average price.
The security is in an uptrend if its moving average increases, whereas a decreasing moving average indicates a downtrend.
Although 15, 20, 30, 50, 100, and 200-day periods are the most common for computing moving averages, traders can choose any days that best suit their trading style and goals.
Now, let's talk more about the crossovers. These signals—which arise when two separate moving averages cross in specific ways—are known as crossovers.
How To Identify The Golden Cross?
When a shorter-term moving average rises over a longer-term one, this is known as a "golden cross" and is seen as an indication of an imminent bull market by analysts and traders. However, it is formed primarily in three stages:
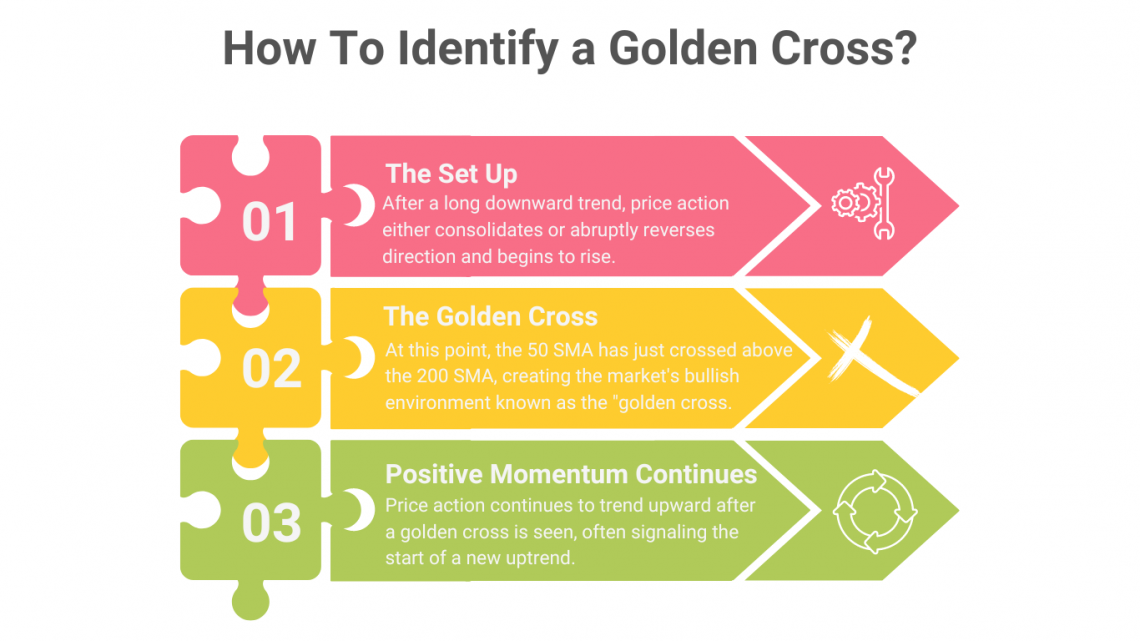
- The Set Up: After a long downward trend, price action either consolidates or abruptly reverses direction and begins to rise. This is the first indication that the downward trend is losing steam and may change. At this time, the 50 SMA is still under the 200 SMA.
- The Crossover: At this point, the 50 SMA has just crossed above the 200 SMA, creating the market's bullish environment. As a result, many traders see the appearance of this as a signal to begin actively seeking entry points into the market.
- Positive Momentum Continues: Price action continues to trend upward after a GC is seen, often signaling the start of a new uptrend. In an ideal scenario, the shorter 50 SMA would provide dynamic support for price movement, and the price would then trade for some time above the 50 SMA.
Examples Of Golden Cross
To further grasp the notion, let's examine some real-world applications.
Example 1:
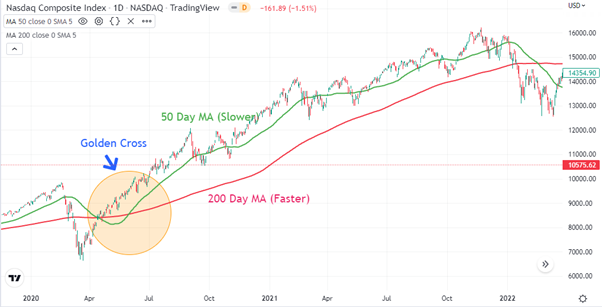
Here is a chart showing the one-day performance of the made-up S&P 500. The chart's green line at 50 days represents the moving average.
The red line shows the 200-day moving average. The diagram indicates that the cross formed by the intersection of the yellow and red lines from below is known as the GC.
This was on the 01st of May, 2020, showing an upward movement of more than 80%.
Example 2:
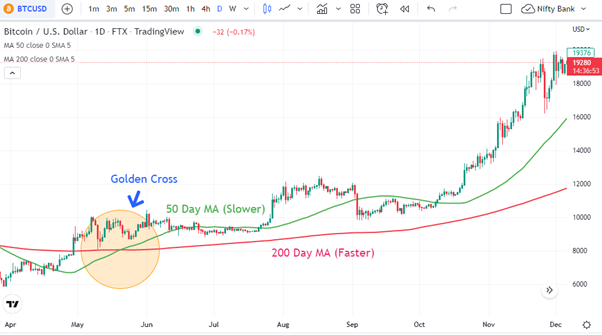
Here is a chart showing the one-day performance of Bitcoin, for example.
For instance, on the 20th of May 2020, it showed an upside movement of more than 700%.
The diagram shows that the cross formed by the intersection of the green and red lines below is known as the GC. This Bitcoin GC indicates a buy.
Golden Cross Vs. Death Cross
When one moving average (MA) crosses another from above or below, it is referred to as the golden or death cross. The former indicates future bullishness in the market, while the latter predicts a bearish market.
This cross happens when a shorter moving average rises over a longer one and is seen as a bullish indicator by technical experts and market participants.
The shorter-term moving average crossing below the longer-term average is known as a "death cross," in contrast.
NOTE
In either event, the market is expected to use the new long-term moving average as a significant level of support or resistance going ahead.
Even while any cross has the potential to indicate a shift in trend, it more often serves as a powerful confirmation of a change in the movement that has already taken place.
Here is a table that summarizes the differences between a golden and a death cross:
| Golden Cross | Death Cross | |
|---|---|---|
| Definition | A bullish signal is formed when the shorter-term moving average crosses above the longer-term moving average. | A bearish signal is formed when the shorter-term moving average crosses below the longer-term moving average. |
| Interpretation | Indicates that the stock may be trending upwards and that the current trend is bullish. | Indicates that the stock may be trending downwards and that the current trend is bearish. |
How to Use The Golden Cross?
Traders may use it to pinpoint optimal entry and exit points. The indicator may also be used as a guide for traders to choose when to sell and when it's preferable to purchase and hold.
In some instances, investors will purchase securities before their 50-day moving average exceeds their 200-day moving average. The GC is usually a very slow predictor of future events. It might happen after the market has shifted from being bearish to bullish.
Short sellers may see this as a sign that the bear market has ended and that it is safe to close out their bets.
NOTE
Traders may choose to utilize various moving averages to signal a GC. A trader may, for instance, choose to use the 100-day moving average instead of the more common 200-day average. Shorter periods, such as an hourly chart, may also be used to search for the pattern.
Last but not least, many experts employ supplementary technical indicators to validate the signal from a GC.
The Average Directional Index (ADX) and the Relative Strength Index (RSI) are two well-liked examples of momentum indicators. Since the Cross pattern often lags subsequent price movement, these indicators might help overcome this issue.
Limitations Of Golden Cross
When it comes to predicting the future, all indicators lag, and none are perfect. In many cases, the perceived GC is a misleading indication.
Although this cross has shown some predictive potential by correctly predicting huge bull markets, they also often fail to materialize. As a result, verifying it with other indications and indicators is crucial before entering a trade.
Proper risk factors and ratios are essential for the practical usage of the GC in conjunction with other filters and indicators.
For example, instead of mindlessly following the cross, it might be beneficial to remember to maintain a positive risk-to-reward ratio and pace your trades appropriately.
Because they reveal the market's behavior across previous periods represented by candles, to put it another way, by the time you get a "signal," it may be too late to join the trade.
NOTE
While these crosses have accurately foretold major bull markets most of the time, they have not always done so. If a GC does not hold, traders who take long positions based on the cross alone may experience short-term losses.
There are a few limitations to using the GC as a technical indicator:
- It's based on past data
- It can be misleading in a sideways market
- It may produce a false signal
- It should not be used in isolation
- It may not be relevant for all markets
Validity Of The Golden Cross
Any technical indication may or may not work with a particular stock or asset class, independent of the specific store or asset class. The fact that the crossovers are a lagging signal is generally cited as a significant flaw of the indicator.
It is impossible to anticipate future price changes using data on past prices. Because of this, it is often used with other indicators or fundamental research when deciding how to trade.
A few factors can impact the validity of a Golden Cross:
1. Market conditions
The GC may be more reliable in a trending market but may not be as reliable in a sideways market.
2. Time frame
The time frame of the chart being analyzed can also impact the validity of the Golden Cross. For example, a GC on a daily chart may have a different significance than a GC on a weekly chart.
3. The moving averages being used
The validity can also be impacted by the moving averages being used. Different moving averages may produce different signals, so it's important to consider the time frame and sensitivity of the moving averages used.
4. The stock being analyzed
The golden cross may not be a reliable indicator for all stocks, as different stocks may have different price patterns and trends.
It's always a good idea to consider multiple indicators and do a fundamental analysis before making investment decisions.
However, one may find this more valuable as a technical analysis tool if they backtest this trading technique on several asset classes and see the intriguing outcomes.
You may anticipate that the market will be higher than where it is six months or a year from now. To answer your question, this cross sure has some validity.
Why does A Golden Cross Indicate Bullishness?
If prices on the short-term MA can break through the long-term MA and find stability, analysts predict a 5-10% increase in the stock price.
Looking at a GC chart, you can expect to see stock prices bottom out before beginning an upward trend and eventually stabilizing above the long-term moving average.
This consolidation indicates that investors are optimistic about stock prices and anticipate that they will stay stable or increase.
Once it has formed, prices will be supported by the long-term moving average for as long as trading continues above that level.
In other words, when more people feel optimistic about a stock, they will want to purchase it at the current price.
There is a high probability that the bullish sessions will continue since the two trend lines are converging, and the short-term MA is riding well above the long-term MA.
Rising stock prices gain momentum as trade volume increases. However, a new technical chart pattern known as the death cross appears when the short-term moving average drops below the support level.
NOTE
Moving averages are used to distinguish between up and down markets. Thus, these crosses may be used as trading methods in and of themselves, with traders needing to do nothing more than the trends that these technical chart patterns reveal.
The Bottom Line
This crossover is a key technical indicator combining long and short-term moving averages in trading.
This formation occurs when an upward-trending short-term moving average crosses over an upward-trending long-term moving average. The 50-day exponential moving average (EMA) and 200-day simple moving average (SMA) play critical roles in a GC.
After crossing, we may improve our odds of making a trade by applying numerous criteria. Finally, the tradable market is a great place to implement a GC strategy. If you trade in the same direction as the higher periods, you boost your odds of success.
Successful trading requires a lucrative trading strategy and good trade management abilities. In addition, stock markets are notoriously volatile, so investors should be prepared for anything.
The strategy has difficulties, but they are the same as those faced by any trading method. Day traders, for instance, are sometimes advised to avoid utilizing longer-term moving averages such as the 200-day and 50-day.
As a result, you should always take measures to actively manage your transaction to shield yourself from unfavorable market responses. To find the best schedule for you, it is advised that you try out several options.
Golden Cross FAQs
It is a solid, bullish price direction that works well in all financial markets when short-term moving averages cross over long-term moving averages to the upside.
The death cross is when the 50-day simple moving average (50MA) exceeds the 200-day simple moving average (200MA). The opposite situation is known as a "Golden Cross," when the 50MA crosses above the 200MA.
Based on TPA calculations, the S&P 500 has performed well on 10, 20, 40, 80, 160, and 320 days following 25 Golden Crosses since 1970. As of 2010, the positive cross has occurred six times in the past ten years. The average performance is 0.88%, 0.98%, 3.25%, 6.73%, 9.57%, and 15.70%.
Yes, a bullish breakout pattern (GC) is created when a security's short-term moving average, such as the 20-day moving average, crosses over its long-term moving average, such as the 50-day moving average.
The pattern occurs when the security's short-term price moving average crosses above its long-term moving average, signaling bullish momentum. A death cross, as opposed to a golden cross, happens when the price of an asset drops below its long-term moving average.

Free Resources
To continue learning and advancing your career, check out these additional helpful WSO resources:


or Want to Sign up with your social account?