Financial Statements Examples – Amazon Case Study
Financial Statements are informational records detailing a company’s business activities over a period.


What are Financial Statements?
Financial Statements are informational records detailing a company’s business activities over a period.
Investors need financial statements to gain a full understanding of how a company operates in relation to competitors. In the case of Amazon, profitability metrics used to analyze most businesses cannot be used to compare the company to businesses in the same sector.
Amazon remains low in profitability continuously to reinvest in growing operations and new business opportunities. Instead, investors can point to the metrics signified in Amazon’s cash flow statement to demonstrate growth in revenue generation over the long term.
There are three main types of financial statements, all of which provide a current or potential investor with a different viewpoint of a company’s financials. These include the following below.
Balance Sheet
The balance sheet represents a company’s total assets, liabilities, and shareholder’s equity at a certain time.
Assets are all items owned by a company with tangible or intangible value, while liabilities are all debts a company must repay in the future.
Shareholders' equity is simply calculated by subtracting total assets from total liabilities. This represents the book value of a business.
Income Statement
The income statement represents a company’s total generated income minus expenses over a specified range of time. This can be 3 months in a quarterly report or a year in an annual report.
Revenue includes the total money a company makes over a set time.
This includes operating revenue from business activities and non-operating revenue, such as interest from a company bank account.
Expenses include the total amount of money spent by a company over time. These can be grouped into two separate categories, Primary expenses occur from generating revenue, and secondary expenses appear from debt financing and selling off held assets.
Cash Flow Statement
The cash flow statement represents a company’s total cash inflows and outflows over a specified time range, similar to the income statement. Cash in a business can come from operating, investing, or financing activities.
Operating activities are events in which the business produces or spends money to sell its products or services. This would be income from the sales of goods or services or interest payments and expenses such as wages and rent payments for company facilities.
Investing activities include selling or purchasing assets, which can include investing in business equipment or purchasing short-term securities. Financing activities include the payment of loans and the issuance of dividends or stock repurchases.
- Financial statements have information relevant for investors to understand the operations and profitability of a business over a specified time.
- Fundamental analysis typically focuses on the main three financial statements: the balance sheet, income statement, and cash flow statement.
- Although analyzing business financials can provide an unaltered outlook into the operations of a business, the numbers don’t always demonstrate the full story, and investors should always conduct thorough due diligence beyond pure statistics.
- Investors must ensure all of a company's financial statements are analyzed before forming a thesis, as inconsistencies in one sheet may be caused by an unusual one-time expense or dictated by a global measure out of the company’s control (ex., COVID-19).
Amazon’s Balance Sheet
Now that we have a general understanding of the financial statements, we can begin to take a look at Amazon’s most recent quarterly filing.
Company filings can be found by using EDGAR (database of regulatory filings for investors by the SEC) or from Amazon’s investor relations website.
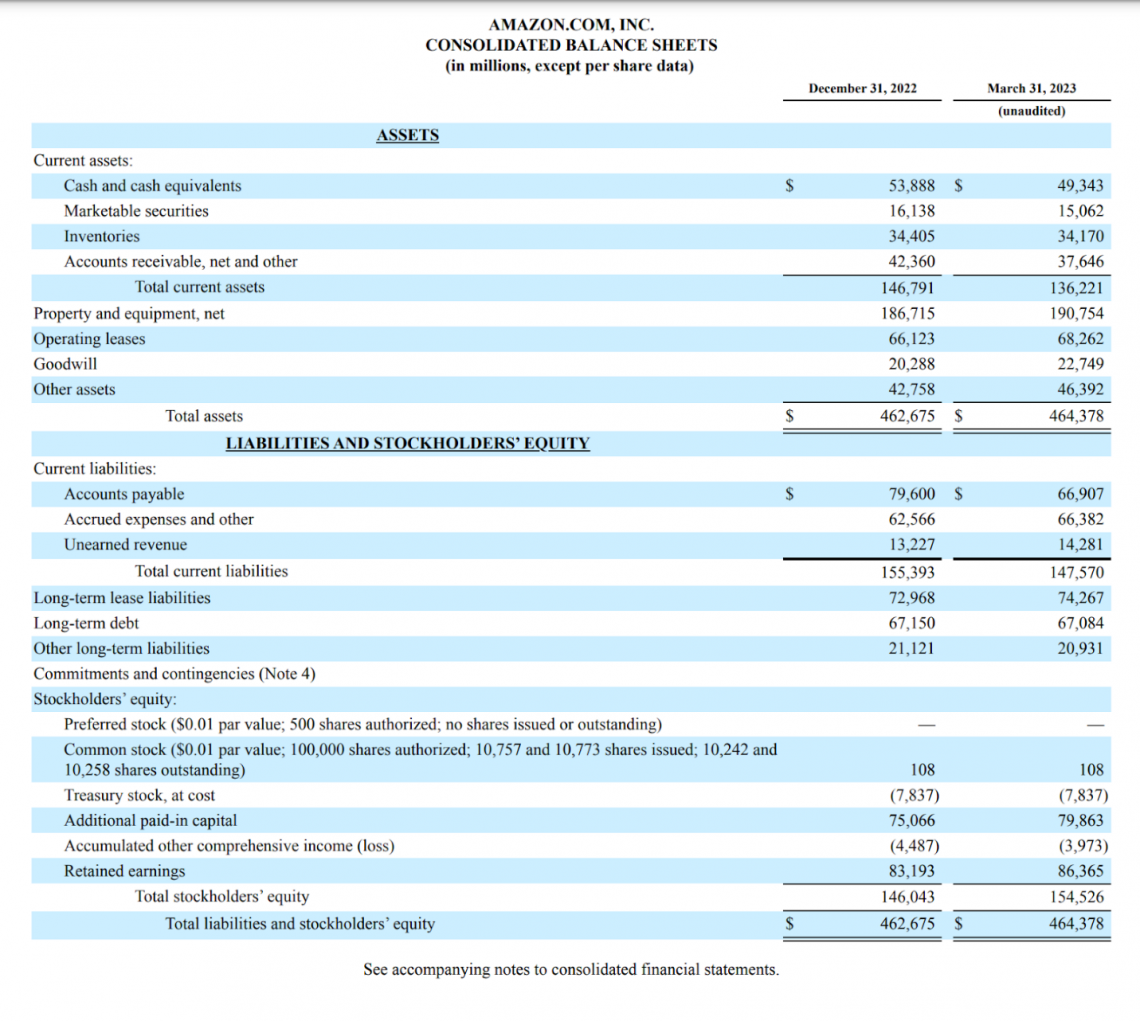
Before we begin analyzing this sheet, it is important to take note of the statement just below the title, indicating that the data is being displayed in millions.
This can throw off newcomers, who may be very confused upon seeing Amazon’s revenue is $53,888. Amazon’s quarterly revenue is indeed $53.8 billion as calculated in millions.
When looking at Amazon’s assets, it is important to note the difference between current and total assets. Current assets are categorized separately due to the expectation that they can be converted to cash within the fiscal year.
Current assets can be used in the current ratio to analyze Amazon’s ability to pay off its short-term obligations. The current ratio formula is:
Current Ratio = Current Assets / Current Liabilities
Amazon’s current ratio sits at 0.92, which is below the e-commerce industry average of 2.09 as of March 2023 (Source: Macrotrends).
Note
This could mean that Amazon is potentially overvalued compared to competitors, but this is only one metric and should ultimately be all of an investment decision, especially considering the capital-intensive nature of Amazon’s business model.
It is also important to understand all of the vocabulary used to detail items in Amazon’s balance sheet. Some of the major items’ definitions can be found below:
Assets are classified as follows.
- Cash and cash equivalents: Assets of high liquidity, such as certificates of deposit or treasury bonds.
- Marketable securities: Liquid securities can be sold in the public market, such as stock in another company or corporate bonds.
- Accounts receivable (A/R): Money owed to the company that has not been received yet, such as from items previously bought on credit.
- Inventories: Unsold finished or unfinished products from a company that has yet to be sold.
- Property and equipment (PP&E): Assets owned by a company that is used for business activities. It may include factory assets or other types of real estate.
- Operating leases: Assets rented by a business for operational purposes. Calculated as the net present value on the balance sheet.
- Goodwill: Calculates intangible assets that cannot be sold or directly measured, such as customer reputation and loyalty.
Liabilities are of the following types.
- Accounts payable (A/P): Obligations accrued through business activities that must be paid off shortly.
- Accrued expenses: Current liabilities for a business that must be paid in the next 12 months.
- Unearned revenue: This represents revenue earned by a business that has not yet received. Prevents profits from being overstated for a specific period.
- Long-term debt: Debts in which payments are required over 12 months.
- Lease liabilities: Payment obligations of a lease taken out by a company.
- Stockholders’ equity: Net worth of a business/asset value to shareholders.
- Retained earnings: Net profit remaining for a company after all liabilities are paid.
Amazon’s Income Statement
Amazon’s next statement in its quarterly filing is the income statement. The income statement is useful for comparing a company’s growth over time and matching it up against competitors in the same or different sectors.
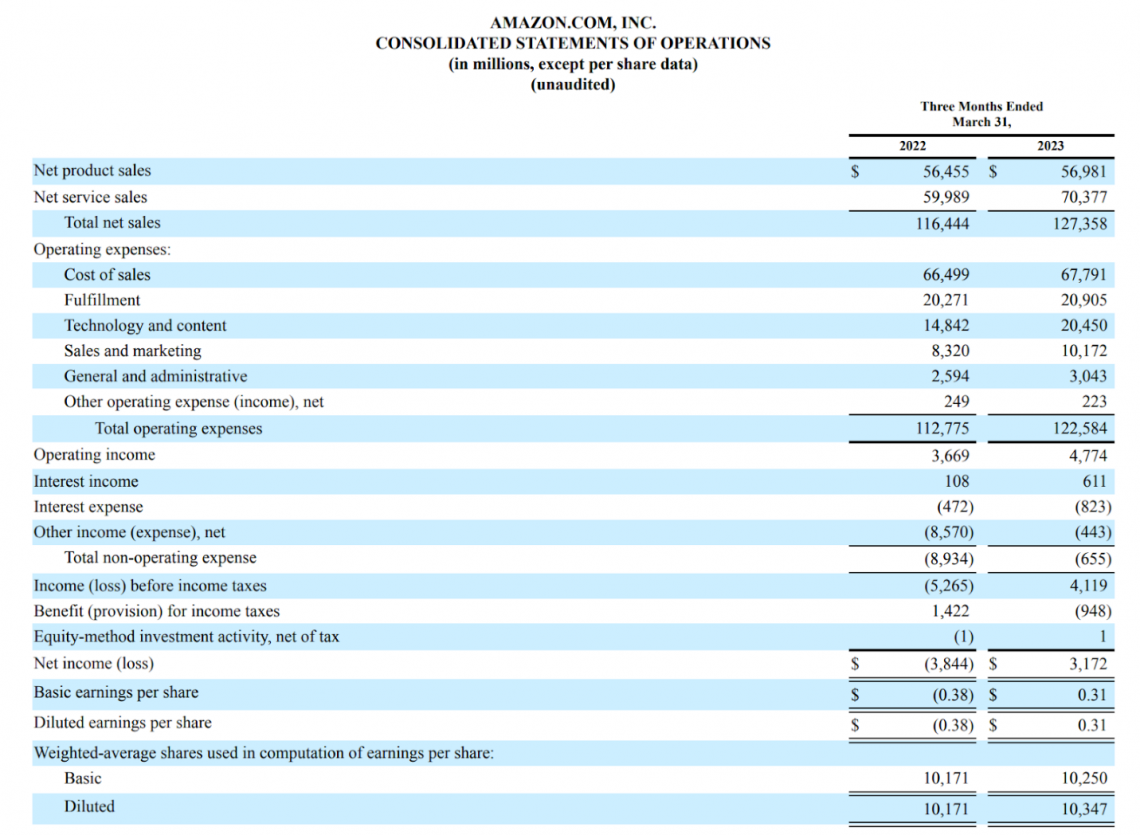
An essential factor to note when looking at a company’s income statement is whether its revenue and net income are consistently growing year over year. Investors should also be aware of Wall Street expectations, as they can heavily influence the business’s share price.
Many important ratios are used when analyzing a company’s income statement. Some of the most notable ones include:
- EV/EBITDA = (Market Capitalization + Debt - Cash) / (Revenue - Cost of Goods Sold - Operating Expenses)
- Gross Margin = (Revenue - Cost of Goods Sold) / Revenue
- Operating Margin = Operating Income / Revenue
- Net Margin = Net Income / Revenue
- Return on Equity (ROE) = Net Income / Average Shareholder Equity (End Value + Beginning Value / 2)
- Earnings Per Share = Net Income / Shares Outstanding
Let’s use these ratios to conduct a comparables analysis between Amazon and eBay, a company at a much lower valuation relative to the e-commerce giant.
Here are their ratios side-by-side, as of Amazon’s Q1 2023 and eBay’s Q1 2023 filings:
| Ratio | Amazon | eBay |
|---|---|---|
| EV/EBITDA* | 25.3x | 8.4x |
| Gross Margin | 46.8% | 72.1% |
| Operating Margin | 3.75% | 29.1% |
| Net Margin | 2.49% |
22.6% |
| ROE | -1.86% | -24.6% |
| Earnings Per Share | -$0.27 | $1.05 |
* = EV/EBITDA ratios sourced from finbox.com, March 2023 trailing twelve months (TTM)
Looking at these statistics on paper, it is clear to see that Amazon seems overvalued compared to eBay due to lower margins, negative earnings per share, and an EV/EBITDA multiple over three times as high as the business.
However, pure stats on an income statement cannot fully justify purchasing one company or another. The statement merely shows what a company is doing without a corporate spin.
One thing to note that is unique about Amazon’s business model is how the company invests huge amounts of capital into R&D and technology to expand its operations continuously.
Their numbers don’t account for the massive cash flows and growth opportunities that the business takes advantage of.
Note
When conducting fundamental analysis, an investor must consider all aspects of a business beyond the financial statements, including comparing business models to competitors and setting benchmarks encompassing the overall sector.
Amazon’s Cash Flow Statement
Amazon’s cash flow statement is where the company begins to shine compared to its competitors in the online commerce sector. The company has consistently increased cash flow from operating activities and constantly returns value to shareholders in the form of capital appreciation.
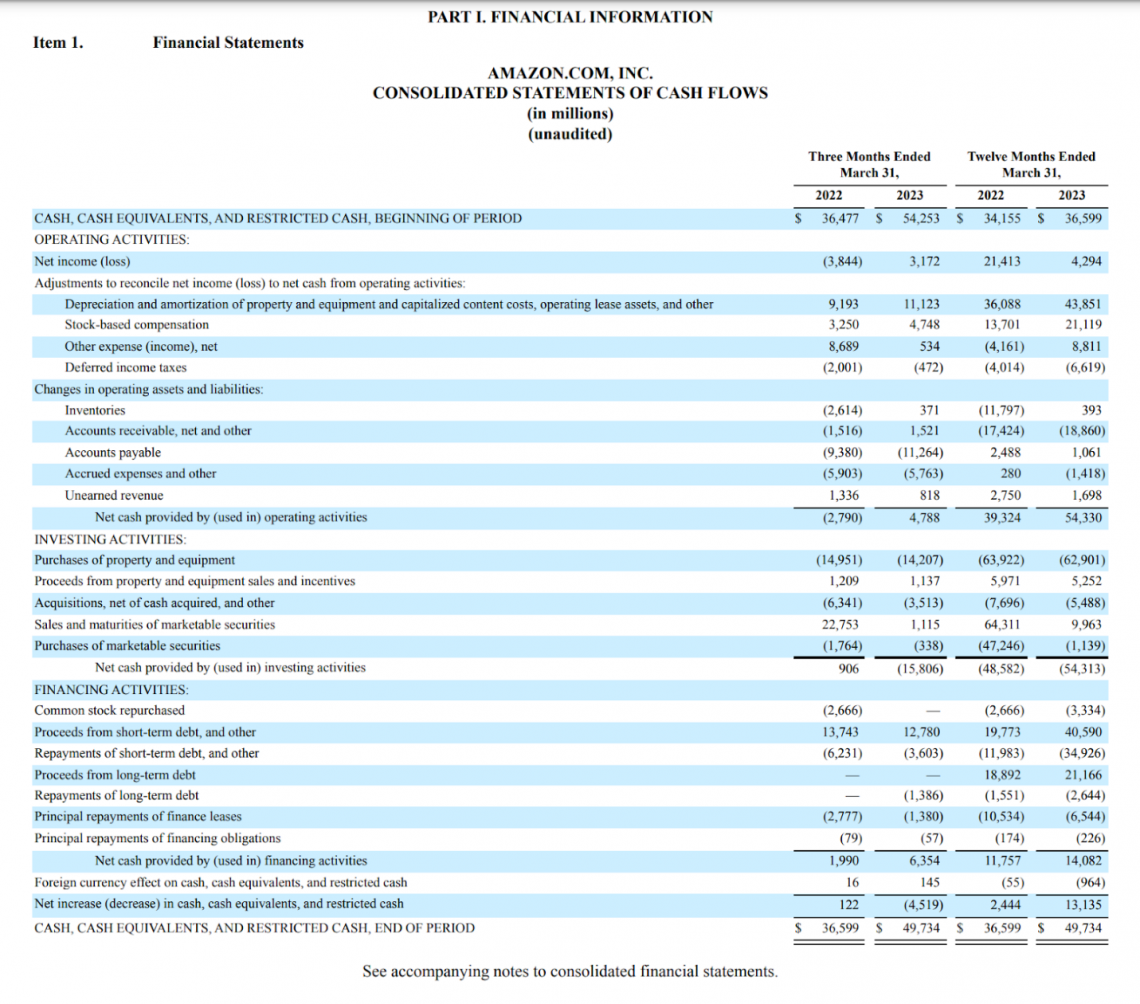
It is notable for focusing on what the company is doing inside of its cash flow statements to get a better picture of why its income or stock price is trending a certain way.
For example, an explosive drop in net income in an otherwise stable company could be due to mismanagement or hampered growth but is most likely due to M&A activity charged in a quarter that may be skewing the numbers. The cash flow statement clears this up.
Compared to 2022, Amazon has increased its annual cash from operating activities by over 38% from the previous year based on a 12-month rolling basis.
This increase has also resulted in an 11.7% increase in investment expenditures, which should allow Amazon to continue growing faster than similar companies.
In comparison, according to eBay’s most recent 10-K filing, the company generated an 82% growth in operating cash flow (OCF), however, this stat can be very misleading due to the company’s lack of investment in processes such as R&D and SG&A.
In 2022, the company reported $92M in investing activities, representing only 26% of operating cash flows. Amazon reported over $37.6B in investing activities representing approximately 88% of its OCF.
The income statement can misrepresent how well a company is doing, as while eBay has a higher net income, Amazon strategically reinvests its cash flows into R&D and other expenses to produce more over time continuously.
What makes the cash flow statement so essential to fundamental analysis is the fact that it is tough to manipulate its numbers through financial engineering or clever accounting.
The statement purely shows precisely where all of the money a company makes is being used. Many investors use the cash flow statement to tell the true financial health of a business, as profits can often not be indicative of a growth company's value.
The stock price of a company can easily be swayed by sentiment or the market cycle, and the income statement can be skewed through large one-time transactions or large amounts of financed revenue. The amount of money in the possession of a company is very hard to adjust.
Amazon currently has much better growth prospects than eBay and thus sells at a higher premium in the open market, but you wouldn’t understand why unless you took in the full picture of the company.

Usage of Financial Statements
Financial statements are excellent tools to learn more about a business in terms of an overall market or sector of operation. Using financial statements to determine the current value of a business is essential for understanding a company’s stock price.
Along with the ratios mentioned, analysts often form their methodologies over time to focus on companies that are strong in specific financial circumstances.
Tools such as stock screeners can sort millions of companies by certain factors. For instance, some investors may seek defensive companies with consistent dividend growth over long periods, while others may seek growth companies with the most innovative new technology.
Investors should keep all of this information in mind, as well as pay attention to the reports of analysts with varied performance outlooks. It is essential to seek out the opinions of multiple sources before establishing an opinion on a business.
Looking at reports from analysts specializing in the industry can also ensure that your expectations are reasonable compared to industry experts.
If your thesis results in Amazon growing its revenues by 20% a year while analysts across the country are only expecting growth in the range of 5-7%, it could be a sign that you may have overlooked a key factor in your due diligence.
Note
The overall goal of using financial statements is to fully understand the company you are investing in to justify a position. Although your views may slightly differ from experts, quality due diligence can result in somewhat varied outcomes based on an investor’s outlook for the future.
Amazon Case Study FAQs
Using EBITDA instead of net income strips away the capital structure and taxation of a business to analyze the pure earnings potential of a business. This is more practical for investors to see the general trajectory of a company’s income over time.
For example, companies may decide on completing a merger or acquiring another company. This will require a company to report its current and acquired assets on its balance sheet.
Over time, these assets must be recorded as expenses through the use of depreciation, which is the process of deducting from gross revenue to account for the decreasing value of company plant assets.
If these assets increase in value over time, this could decrease revenues over time not due to company performance but because of increased prices for equipment outside of the company’s control.
Without looking at EBITDA, company financials may paint a completely different picture with the use of net income that may or may not be justified at all.
ROE is an important metric to distinguish how good a company is at generating profits with investor capital compared to its share price and competitors. It is yet another indicator used to analyze the trajectory of a business over time.
Using ROE can also demonstrate how much financing a company requires to generate its revenue and if investors are really getting a great return for the amount of money shareholders contribute.
A startup that has recently gone public on the stock exchange may have a very low to negative ROE compared to an established company. Still, the startup may have the margins and growth to justify its valuation.
Much like every financial ratio, ROE doesn’t demonstrate the entire story of a business, and the full picture of a business must be considered to decide on an equity investment.
To proliferate and take market share from competitors, Amazon undercuts prices on many products to decrease competition and remain the top player in the industry.
Amazon, like many other companies recently since the pandemic, has also faced significant increases in operating expenses, thus lowering operating and net margins in the short term. Once Amazon begins to slow expansion, these margins are expected to rise.
Amazon’s net income is very low for many of the same reasons. The company is profitable yet is constantly reinvesting into new businesses and products to further grow cash flows for future expenditures.
Amazon investors are not focused on income but rather on its ability to continuously grow in the long term. Growth companies like Amazon do not issue dividends because they believe that the money is better reinvested in business operations.


Researched and Authored by Tanner Hertz | LinkedIn
Free Resources
To continue learning and advancing your career, check out these additional helpful WSO resources:


or Want to Sign up with your social account?