Using the Three Financial Statements in FP&A
Financial statements are essential externally and internally to evaluate a company's performance


What are the Three Financial Statements?
Financial statements are essential externally and internally to evaluate a company's performance. Therefore, financial planning and analysis (FP&A) is primarily concerned with optimizing a company's internal operations so that company finances are used as efficiently as possible.

Knowing this objective at a basic level, it is clear that the three financial statements are essential for FP&A professionals. This is because economic views and other financial reporting are subject to analyst review and forms the basis for suggestions moving forward.
Of all financial documentation reviewed by analysts, the three statements that are typically the primary focus include:
- The Balance Sheet
- The Income Statement
- The Statement of Cash Flows
Because these statements detail a company at a macro level, being familiar with these three primary statements is essential for anyone working in FP&A.
- Financial statements (balance sheet, income statement, cash flows) are vital for evaluating a company's performance, aiding financial planning and analysis (FP&A).
- FP&A aims to optimize internal operations using financial insights and efficiently use company finances.
- FP&A professionals heavily rely on balance sheets, income statements, and cash flow statements to analyze company performance.
- These statements help FP&A analysts create budgets, forecasts, and tailored recommendations for optimal resource allocation.
- Using ratios derived from financial statements, FP&A experts measure performance and make informed decisions for effective financial management.
- Financial statements serve as a foundation for FP&A analysts, guiding strategic choices that maximize financial efficiency and success.
The Balance Sheet
The balance sheet is often described as a snapshot of a company. This statement details the company's assets, liabilities, and shareholder's equity at a company at a specific point in time. For this reason, it is common practice for balance sheets to include financial information from multiple points in time for quick comparison.
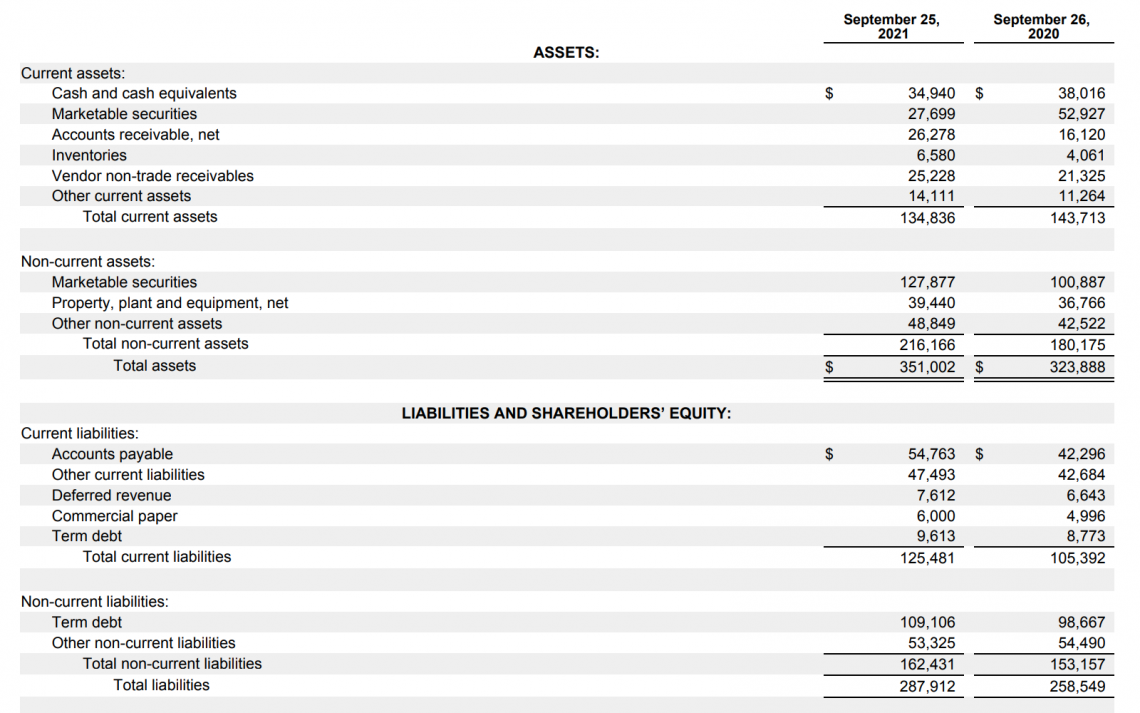
Another critical aspect of the balance sheet is that it is formed with equality. Total assets are equal to total liabilities and equity and create a balance. This balance is often referred to with the equation:
Assets = Liabilities + Equity, or Investments - Liabilities = Equity
Using this equation, we can begin to structure the balance sheet. Typically, assets are on the left side, whereas liabilities and equities are on the right. It is also possible to organize the balance sheet vertically, as in the example above. However, it is essential to note that the exact relationship between assets, liabilities, and equities remains true, even though it is not visualized.
In both the assets and liabilities categories, we differentiate items into separate subsections based on either liquidity (assets) or the time until they are due (liabilities). For current assets/liabilities, that period is one year or shorter. The period is more significant for long-term assets/liabilities than one year.
Beyond these significant subcategories, we can find more specific information. For example, we can find cash and equivalents, accounts receivable, and inventory in current assets.
Seeing information in this level of detail helps analysts understand the makeup of a company's assets beyond what is just current and long-term. Later these specifics will be used to construct ratios measuring company performance.
It is also important to note that the values used in balance sheet construction are the closing values on the previous balance sheet. These are adjusted following any changes or activity in the period between the last and current balance sheet. Some examples include retained earnings, which affect equity, and financing changes.
The Income Statement
The income statement, otherwise known as the profit and loss (P&L) statement, details the net changes after income and expenses during a specific period. Because this statement is ultimately about a company's bottom line, it is a core statement measuring performance. Unlike the balance sheet, which details a specific point in time, the income statement measures performance over its reporting period.
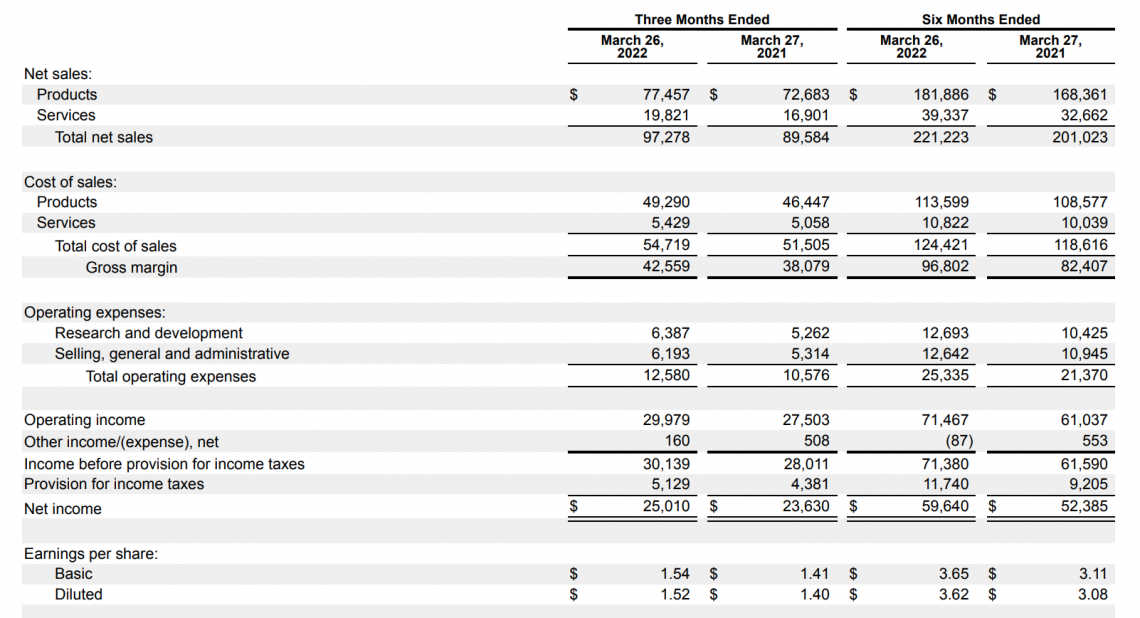
For example, a quarterly earnings report would have a quarter reporting period, while an annual report would detail the company's profit and loss for the whole year.
Because the income statement is concerned only with the activity of its specific period, it follows that its construction can be done without reference to past earnings. Instead, income statement preparation requires a series of figures that will be deducted from total revenue to indicate a company's net income.
In a series of steps moving down toward net income, we are left with several different metrics. These include:
1. Gross profit, which equals total revenue minus cost of goods sold.
Gross Profit = Revenue - COGS
2. Operating profit, which equals gross profit - operating expenses
Operating Profit = Gross Profit - Operating Expenses
3. Earnings before interest, taxes, depreciation, and amortization equals operating profit plus any other income.
EBITDA = Operating Profit + Other Income
4. Earnings before interest and taxes are equal to EBITDA - depreciation, and amortization.
EBIT = EBITDA - Depreciation - Amortization
5. Net income, which equals EBIT minus interest expense and taxes.
Net Income = EBIT - Interest - Taxes
Although not all of these specific measures are included in the income statement, they can be calculated as one moves down. For example, it is common to have:
- Gross Profit
- Operating Income
- Net Income
The easiest way to understand net income is that it is equivalent to total revenue, less all expenses plus the net of any other income.
Recall: In the balance sheet section, we mentioned equity changes resulting from retained earnings. This is the critical piece of information that is translated to the balance sheet from the income statement. Retained earnings are net income with fewer dividend payments.
The Statement of Cash Flows
The statement of cash flows is another statement that tracks transactions over a specific timeframe. The statement of cash flows is crucial in understanding how a company uses and generates cash. It includes:
- Operating activities
- Investing activities
- Financing activities
In construction, the cash flow statement is similar to the balance sheet and income statement. Like the balance sheet, it begins with the ending balance of the prior cash flow statement. This is now designated the beginning balance. Like the income statement, all other statement categories start fresh and include only transactions in that specific period.
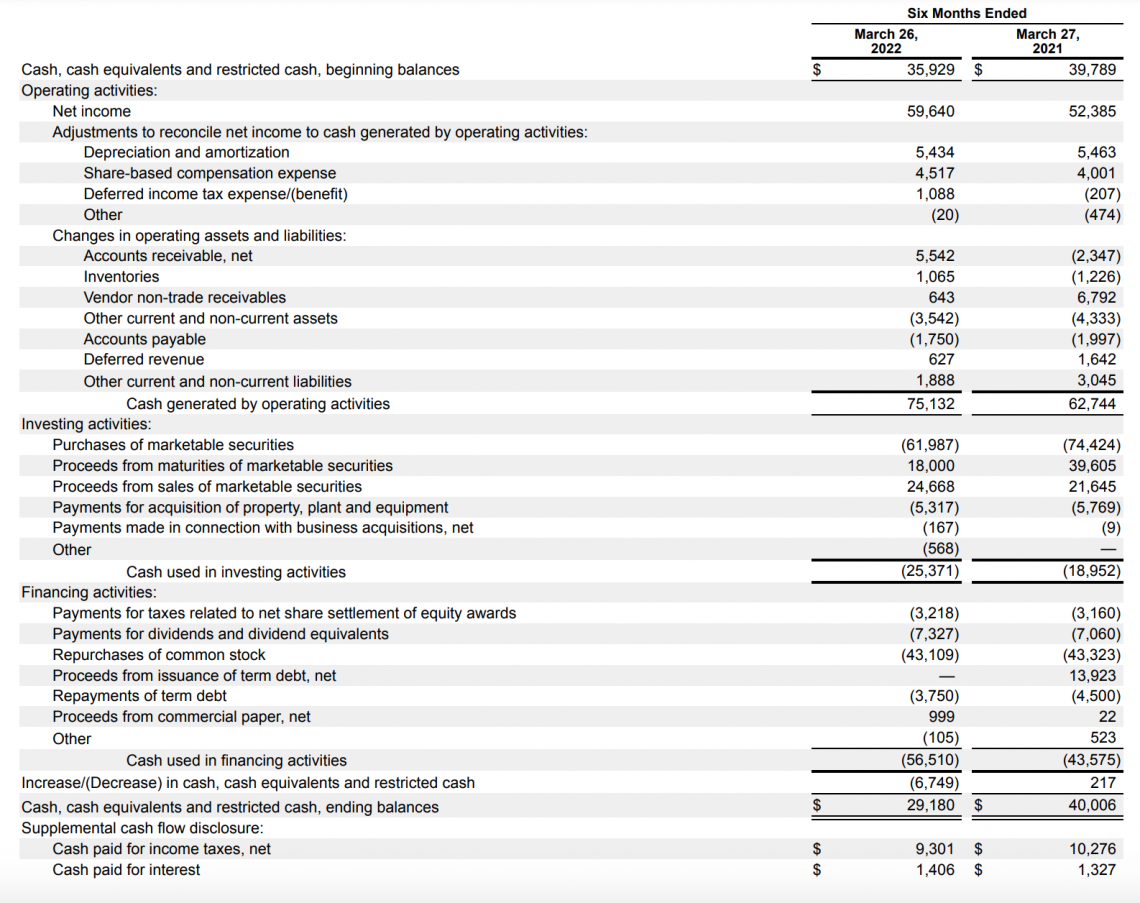
The first category of the statement of cash flows is business operations. This section covers all operating activities, making adjustments from net income to better reflect the actual cash amount the company has on hand.
An easy-to-understand example is accounts receivable, which represents money not yet collected from sales that were counted in the revenue section of the income statement. If this money is not yet collected, the business cannot use it. It, therefore, should not be expressed as a contribution to the balance of cash.
The following section, cash flows from investment, details the net change in the cash balance from investing activities. This category includes changes in cash balance due to either capital gains or losses from selling existing investments.
Cash flows from investing include buying and selling property, plants, and equipment (PP&E). Although property, plant, and equipment are used to generate some money via operations, their purchase and sale are treated as long-term investments.
Another reason PP&E is included in investment cash flows rather than operating cash flows is to conclude better how much cash the business nets from its operations alone.
If PP&E were included in operating cash, the total from operations would be significantly swayed by the purchase and sale of plant, property, and equipment, unnecessarily complicating the interpretation of the operating cash closing balance.
The final part of the cash flow statement is cash from financing activities. This category includes any money transactions between a company's shareholders and creditors. These cash flows help bridge the gap of any shortage the company may have in terms of operating.
Examples of cash flow from financing activities are:
- Dividend payments
- Debt payments
- Stock buybacks
- Issuance of equity shares
- Any other form of new debt the company is taking on
This statement of cash flows is critical to understanding the balance sheet's cash section and liabilities and equity structure changes.
Why are Three Financial Statements Important to FP&A Analysts?
With an understanding of the role of an FP&A analyst, it is no surprise that the three financial statements are critical for decision-making in a company. In fact, for each responsibility of an analyst, it is almost certain that reference to the three financial statements will be necessary.
First of all, what is expected of an analyst? FP&A professionals' duties are all about maximizing the efficiency of a company. They do this by analyzing all financial activities through careful examination, and consequently, they can determine whether internal processes are optimized.
More specifically, FP&A analysts are expected to generate the profit and loss statement (P&L) and other financial reports, determine profit margins, create company budgets, plan for different scenarios, and build ad-hoc reports.
Beginning with the creation of the P&L and statement of cash flows, it immediately becomes clear that the three financial statements are integral to an analyst's responsibility.
An analyst must understand these statements at a high level to construct them and analyze different ratios to evaluate company performance.
When creating the P&L, the FP&A professional will often break down revenue and expenses by the department to better understand the drivers of net profit.
Of the products, product lines, or services, it is essential to understand where the most significant impacts are from. This assists in creating both budgets and forecasts.
For example, suppose a specific product line drives a large portion of the revenue. In that case, the FP&A analyst may allocate a larger budget to the department managing that product line.
The analyst could then use this new budget to forecast revenue for the next period and see its impact on overall company performance. Another way that analysts can look to create budgets and forecasts moving forward is with a cost-efficiency lens.
Instead of just looking at the most significant revenue drivers, analysts could opt to allocate resources based on how much value a specific department brings, given their current percentage of the overall budget.
Suppose a part of the company driving a small portion of revenue is doing so at a much more cost-efficient rate, for instance. In that case, the analyst may recommend increasing that department's overall amount of budget.
With their understanding of impacts on company performance not just as a whole but on a detailed level, it is pretty clear why they are trusted to both different forecast scenarios and make recommendations to company executives.
Scenario planning is when an analyst forecasts company performance with other sales and revenue expectations. Typically this includes a best-case scenario, an expected outcome, and a worst-case scenario. This helps a company efficiently plan how to react depending on how numbers look during the next period.
It is clear why this responsibility also depends on knowledge of the three fundamental financial statements. Significant are the income statement and statement of cash flow forecasts, which will ultimately affect the company's financial performance as measured on the balance sheet.
Scenario planning is also done with ratio analysis, where FP&A analysts look at various ratios as metrics. For someone making recommendations to company executives, It would be advantageous to understand how these ratios would change as measured by scenarios.
These ratios include the debt to equity ratio or the cash ratio. Not only are these ratios important internally for measuring performance, but improving these ratios would be an objective of executive management concerned with investor relations.
As FP&A analysts become highly familiar with these ratios, their forecasts, and how they may change based on different scenarios, it is pretty clear why company executives rely on the FP&A team for ad-hoc (on-demand) reporting, which tends to be quite specific.
Let's look back over the responsibilities that an FP&A professional has. The common theme is that they must analyze financial reports to evaluate the best steps forward.
These analysts must constantly reference the three primary financial statements when creating financial reports, budgets, forecasts, or tailored recommendations. Therefore, an in-depth understanding is necessary.
Three Financial Statements In FP&A FAQ

Retained earnings from the income statement change equity in the balance sheet. Operating, investment and financing activities on the cash flow statement change the balance sheet's assets, liabilities, and equity.
Financial statements help in evaluating company performance.


or Want to Sign up with your social account?