Altman’s Z-Score Model
A multivariate numerical measurement used to predict the chance of a business going bankrupt in the next two years.


What Is Altman’s Z-Score Model?
Altman's Z score model is a Multivariate Numerical measurement used to predict the chance of a business going bankrupt in the next two years.
Formed by Edward Altman in 1968, the model uses various financial ratios based on the company's balance sheet to distinguish between bankrupt and non-bankrupt firms.
Human beings love making predictions, whether predicting the weather or the future of a business, but accurate predictions involve more than mere guesswork.
They require analysis of all sorts of situations and calculations accordingly. It is a model with an 80-90% accuracy rate that can help with these predictions.
Explanation: Born in 1941, Edward Altman holds a P.H.D. in finance and is a Professor of Finance, Emeritus at N.Y.U. Business school. Best known for his Z score formula, he was inducted into the Fixed Income society's Hall of Fame in 2001.
The idea behind this formula came to Edward's mind through discriminant analysis techniques Ronald Fisher gave during the great depression of the 1930s. He developed a customized version of his techniques.
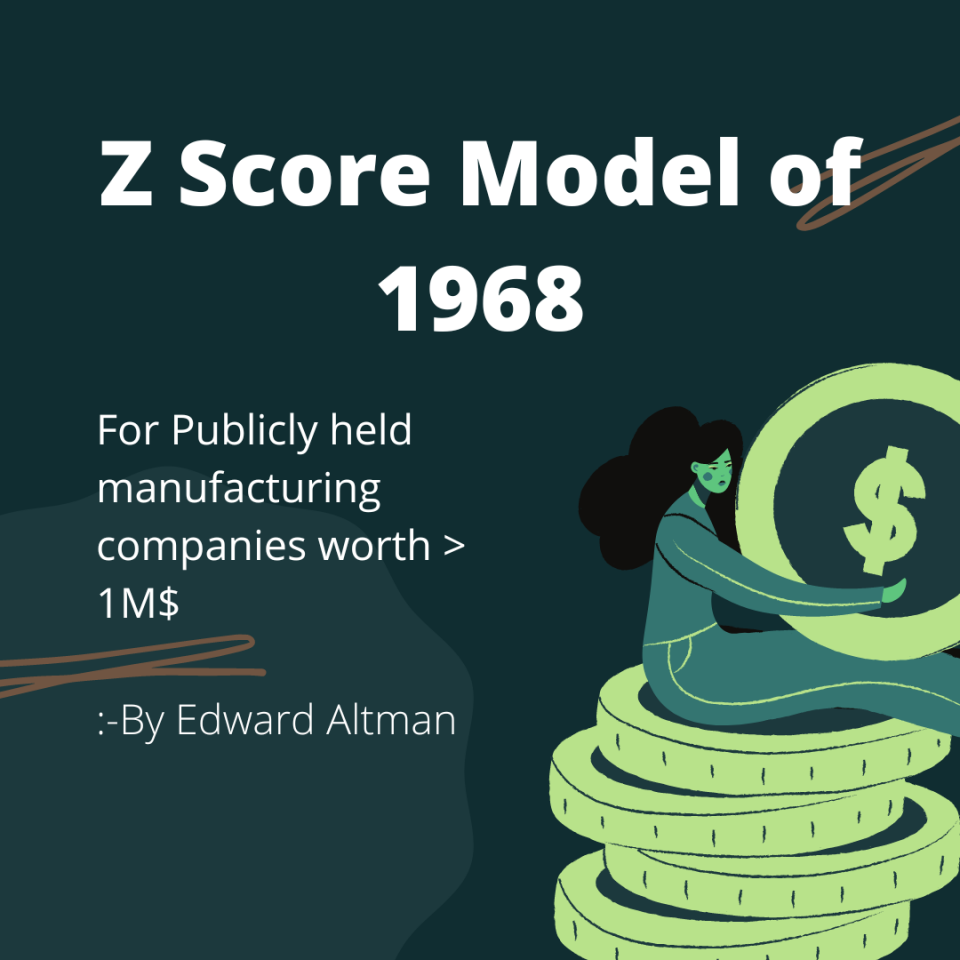
The original formula of 1968 was designed for publicly held manufacturing companies with a net worth of over 1 million USD.
At that time, it excluded other companies for several reasons. But with time, Altman had come up with modified versions of the model to predict Zeta's for non-manufacturing and private companies.
Published mainly for publicly held manufacturing companies in 1968, Altman's equation has been doing a great job from the beginning by distinguishing companies on the verge of bankruptcy.
Financial records of only public companies were easily available and more reliable, so it was the reason Altman chose a specific group for study at that time.
Later on, he went on to analyze more companies in the coming decades. Making it relevant in the 2008 crisis and even today after 50 years.
Altman started evaluating 66 public companies with 22 financial ratios categorized into solvency, liquidity, etc. Still, he modified the model with time and came out with the Z score Plus model, which uses only five financial ratios.
- Altman's Z-Score model, created by Edward Altman, uses financial ratios to predict the likelihood of a business going bankrupt within two years.
- With an 80-90% accuracy rate, the Z-Score model helps assess financial distress and bankruptcy risk.
- The Z-Score combines five ratios, assessing working capital, earnings, profitability, market value, and liabilities, to gauge a company's stability.
- Higher Z-Scores (above 2.99) indicate lower bankruptcy risk, while lower scores (below 1.8) suggest higher vulnerability.
- The Z-Score model remains valuable, predicting financial troubles during crises like the 2008 recession and the 2020 pandemic.
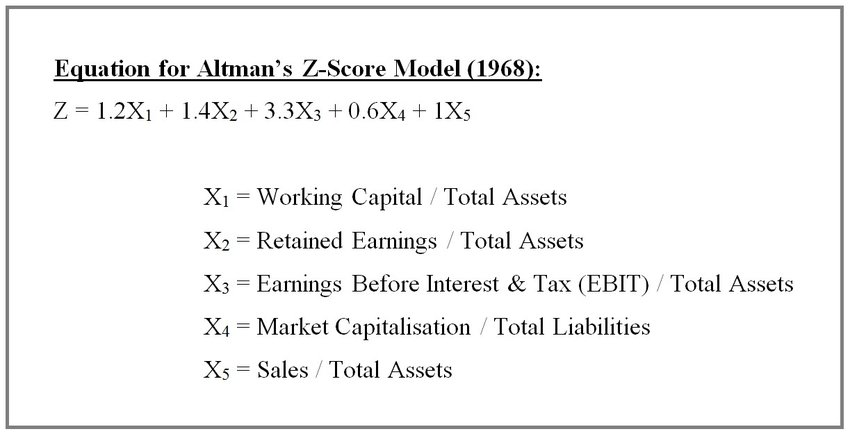
Altman’s Z-Score Model Formula
The formula for the model is shown below:
Zeta, which is the Z score, is the outcome of the model that determines whether the company being analyzed is under financial distress or not and if it's likely to go bankrupt.
Zeta values lie between O-4, with the upper value being flexible.
X1= Working Capital / Total asset Ratio
Working capital is a financial metric representing operating liquidity available to a business and is measured as the difference between current assets and current liabilities.
Total assets are taken from the company's annual financial report filings. The higher the ratio, the better.
X2= Retained Earnings / Total asset Ratio
Retained earnings (RE) is the amount of net income left over for the business after it has paid out dividends to its shareholder. The decision to provide retained earnings is with management and is vital to the company's value.
X3= EBIT/ Total asset Ratio
EBIT, i.e., earnings before interests and taxes, is calculated by subtracting interest and tax expenses from revenue generated by a company during the fiscal year.
It can also be referred to as operating profit or profit before interests and taxes. Calculating this ratio can infer how well a company uses its assets to generate profits. Hence, determining the profitability of the company.
X4 = Market value of equity / Total asset ratio
It is not the same as book value, but it is also known as market capitalization. It is calculated by multiplying the total number of outstanding shares by one share's market value. It can also be referred to as the total value given by the investment community to a business.
X5 = Total sales / Total Liabilities Ratio
Total sales refer to the total income generated by a company by sales of all goods and services. At the same time, total liabilities comprise current liabilities and non-current liabilities.
Liabilities that are meant to be paid within a year are current liabilities, and those which are payable after a year are non-current liabilities.


Analysis and interpretation of Altman’s Z-Score Model
After due calculations of the ratios mentioned above, the value that comes as output is Zeta, i.e., Altman's Z score. Usually, a company with a low score is more likely to go bankrupt under financial distress.
Through due analysis of the number, we determine if the company is under financial distress and facing bankruptcy soon.
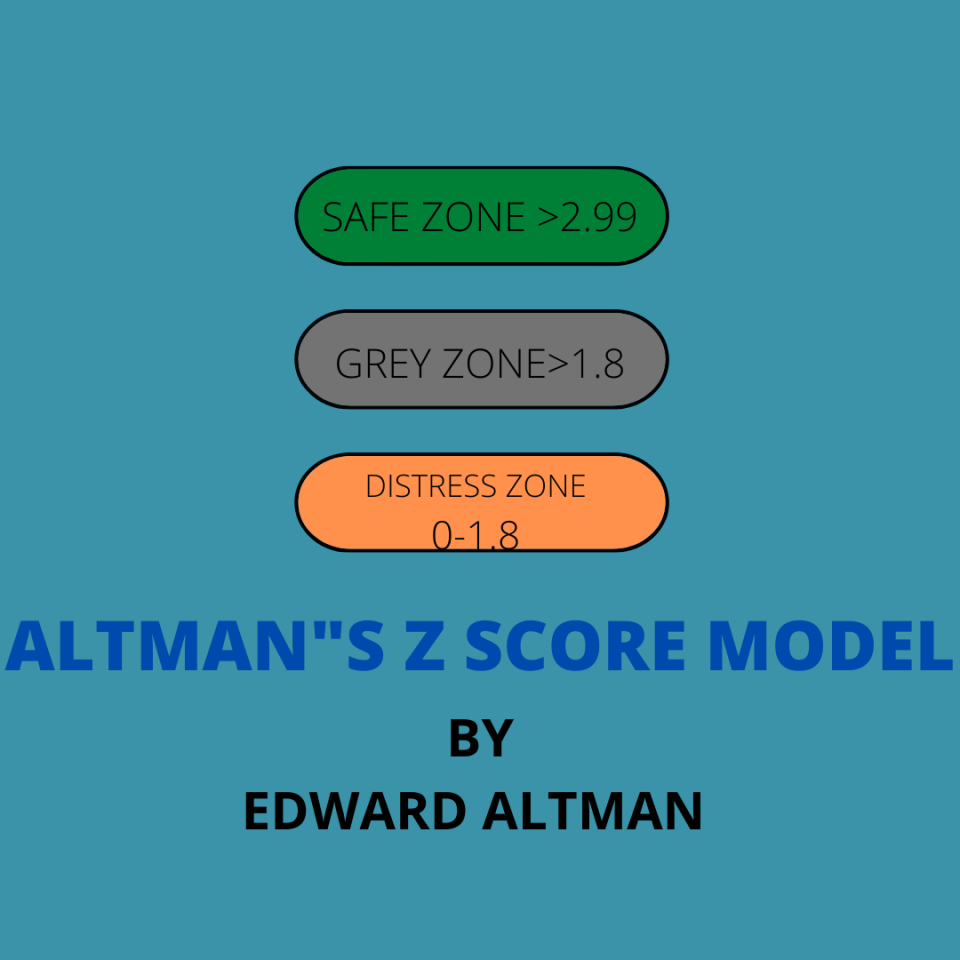
Range of Z score and observations accordingly:
- According to the model, a company with a score greater than 2.99 means it's in a safe zone and under no financial distress.
- A company with a score of 1.8 < Z > 3, i.e., greater than 1.8 but less than 3, puts the company into a gray zone, meaning the company is under financial distress and has a high chance of going bankrupt shortly.
- A company with a score of 0 < Z > 1.8, i.e., greater than zero but less than 8, puts into a distress zone, making it most vulnerable to bankruptcy because of financial distress.
Now, after understanding the formula and terms related to the model, the purpose behind formation remains the same, i.e., to measure a company's financial health and predict if it's under financial distress and likely to go bankrupt or not.
With 80-90% accuracy, it is one of the best credit default or risk analysis models. Altman's Z score model was initially formed for publicly held companies with a $1 Million valuation. Later on, customized models were prepared accordingly for other institutions as well.
Following are the formulas and values to predict bankruptcy for other institutions:
For private manufacturing firms
Model A Z-Score = 0.717A + 0.847B + 3.107C +0.420D +0.998E
- Above 3.0 means that the business is unlikely to go bankrupt
- 1.8 to 3.0 means that bankruptcy can not be predicted as value lies in the gray area
- Below 1.8 means that bankruptcy is likely
For private general companies
Model B Z-Score = 6.56A + 3.26b + 6.72C +1.05D
- Above 2.6 means the business is unlikely to go bankrupt
- 1.10 to 2.6 means that bankruptcy can not be predicted as value lies in the Gray area
- Below 1.10 means that the business is likely to go bankrupt
Altman’s Z-Score Model Example
So after going through the formulas and concepts, it's time to do the reality check by applying the Z score model to X.Y.Z. Motors' financial reports for the year 2022.
We have taken the Financial records of Ford motors for the fiscal year 2021-22 as an example of records for X.Y.Z. Motors.
Financial values as per records:
- Current Assets = $108,996
- Current Liabilities = $90,727
- Total Assets =$ 257,035
- Retained Earnings = $35,769
- EBIT = $131,818
- Market value of equity = $578,000
- Total liabilities= $208,413
- Total sales = $136,341
A = working capital / total assets ratio
Working capital = C.A - C.L.
=$18,269
A= 18269/257035 = 0.071
B = Retained earnings / Total assets ratio
B = 35769 / 257035
B = 0.14
C = EBIT / Total assets ratio
C = 131818 / 257035
C = 0.513
D = Market Value / Total assets ratio
D = 578000 / 257035
D = 2.24
E = Total sales / Total Liabilities
E = 136341 / 208413
E = 0.65
Zeta = 1.2 A + 1.4 B + 3.3 C + 0.6 D + 0.99 E
Z = 1.2(0.071) + 1.4(0.14) + 3.3(0.513) + 0.6(2.24) + 0.99(0.65)
Z = 0.0852 + 0.196 + 1.6929 + 1.344 + 0.6435
Z = 3.962
So as you can see, the Z score for X.Y.Z. Motors is 3.963, which is beyond the satisfactory scale of 3. However, it means the company is unlikely to go bankrupt soon under financial distress.
Note
The example is completely theoretical and shows the practical application of Altman's Z score model.
Altman's Z-Score Model Disadvantages
Some of the disadvantages are:
1. Manipulative: Most of the values are from the company's financial statements, which can be manipulated. The score is only accurate when the data used in the calculation is correct.
2. Inaccurate timing: As the Z score changes from quarter to quarter, the final score may not represent the actual position of the company due to one-time write-offs, e.g., bad debts.
3. Limited application: Even after various updates to the model, It can't correctly analyze newly formed companies or companies with low earnings. Hence, limiting its use to only established firms.
The financial crisis of 2007–2008 and Altman's Z-score model
During the period leading up to 2008, even if you were bankrupt, you could get a housing loan: no background checks, adjustable rates, and even no collaterals, nothing.
This eventually led to the formation of a bubble called the housing bubble, which started bursting when people began defaulting on loan payments, and reality came to the big screen, causing a subprime mortgage crisis.
But what has all this to do with Altman's model?
The bubble formed because credit rating agencies gave ratings of around 90-95% buy on the mortgage bonds. But they didn't research both ends.
On one side, these bonds of value were floating freely in the market without checks, and on the other, defaults and rates increased. Eventually, the Z score model was used to predict corporations going bankrupt due to high-risk investments.
Hence, the crisis started slowly, and when corporations went bankrupt, the use of the model became very important.
Conclusion
The model is an effective method of predicting the state of financial distress of any organization. Hence, many investment managers and hedge funds use it in their investment strategies and management.
According to some financial pundits, the model is still relevant in today's time even after 50 years of its formation. For example, during the pandemic period of 2020, many Fortune 500 companies were under financial distress according to this model, which was true due to the pandemic recession and hardships.
As a part of cost-cutting plans, companies laid off many employees, which was criticized but was necessary to save firms from going bankrupt. In addition, governments were providing stimulus packages to push demand and save the economy.
Analysts now say neither the Altman model nor any balance sheet models are recommended because of the opacity of financial statements as they can be subject to window dressing. Extensive market data rather than accountancy ratios are used for current default and bankruptcy prediction models.


Researched and authored by Arshnoor Kamboj
Free Resources
To continue learning and advancing your career, check out these additional helpful WSO resources:


or Want to Sign up with your social account?