2021 League Tables
As requested by some of y'all on this forum, here are the 2021 league tables, courtesy of Factset.
Global
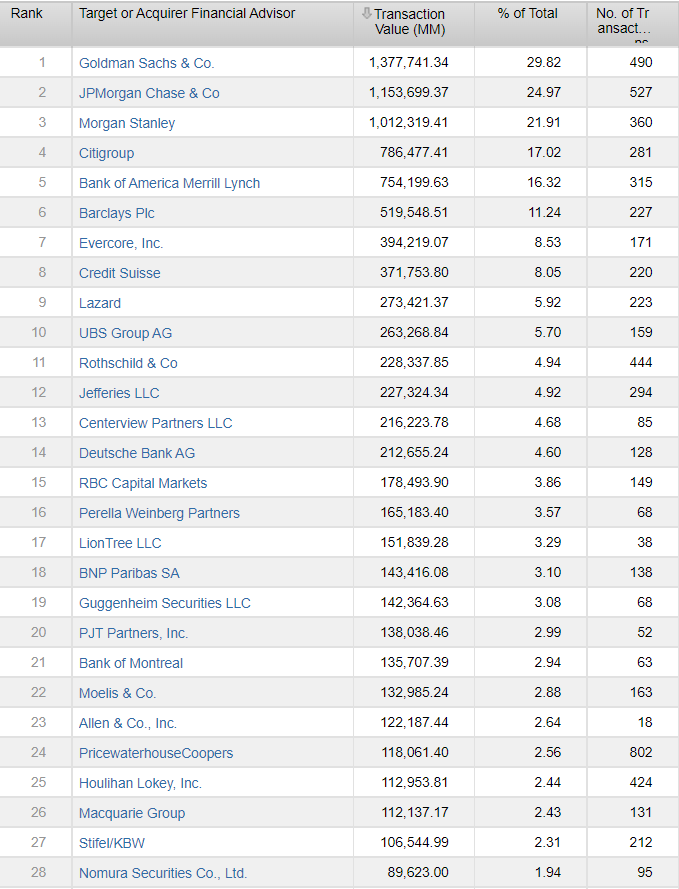
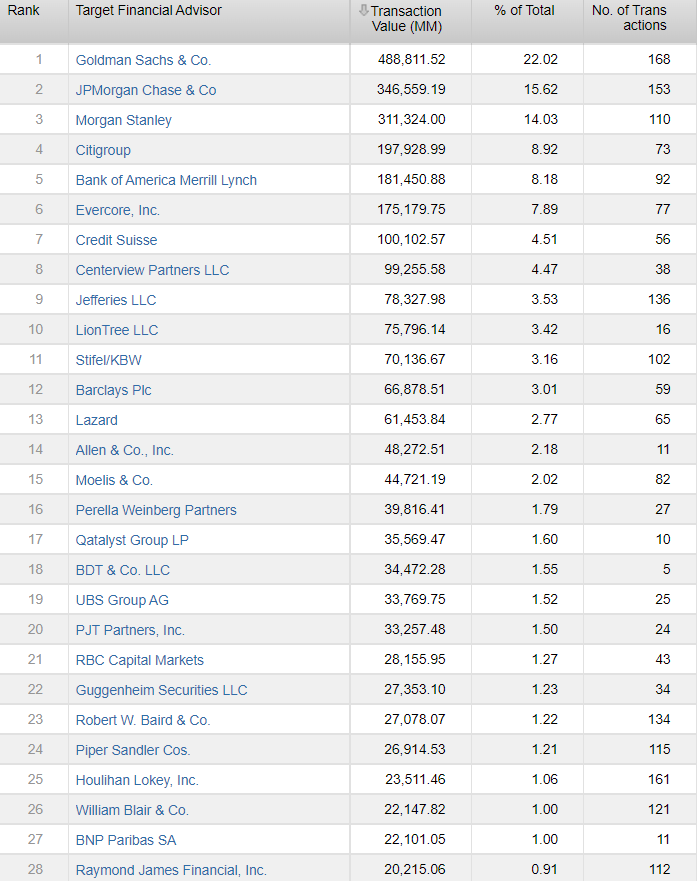
Global League Tables - Sell-side Advisors
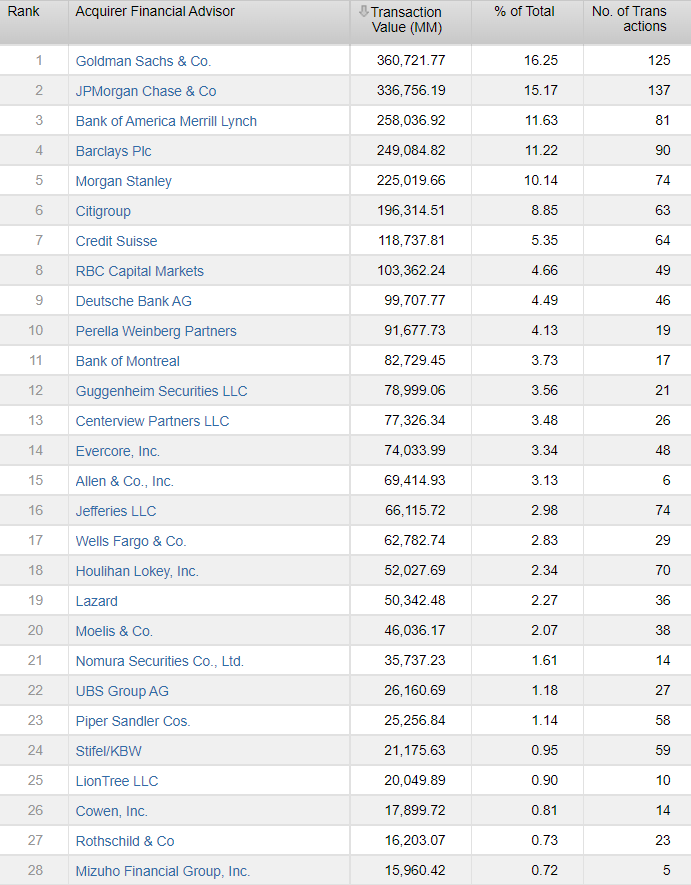
Global League Tables - Buy-side Advisors
United States
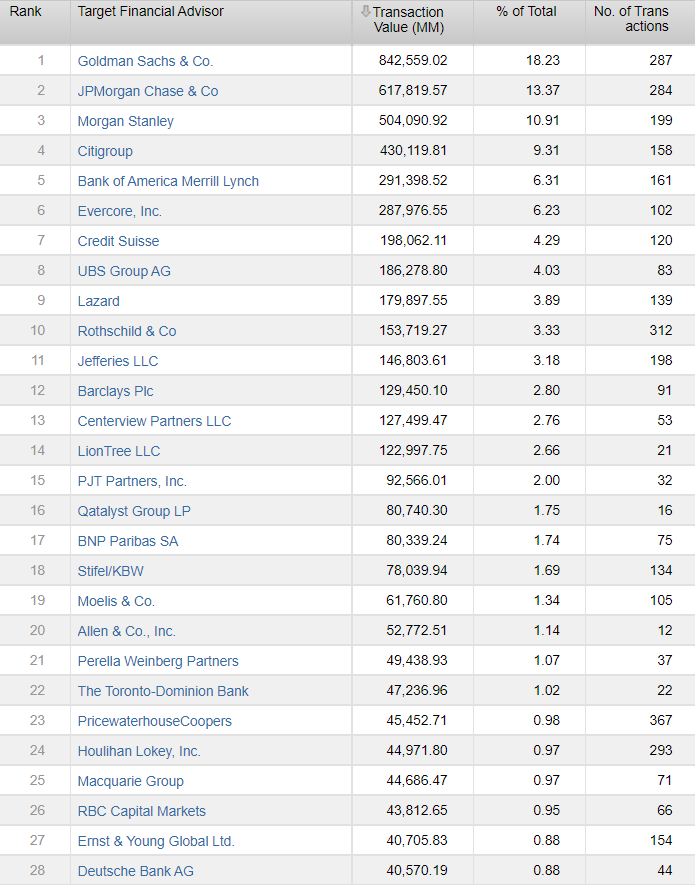
United States League Tables - Sell-side Advisors
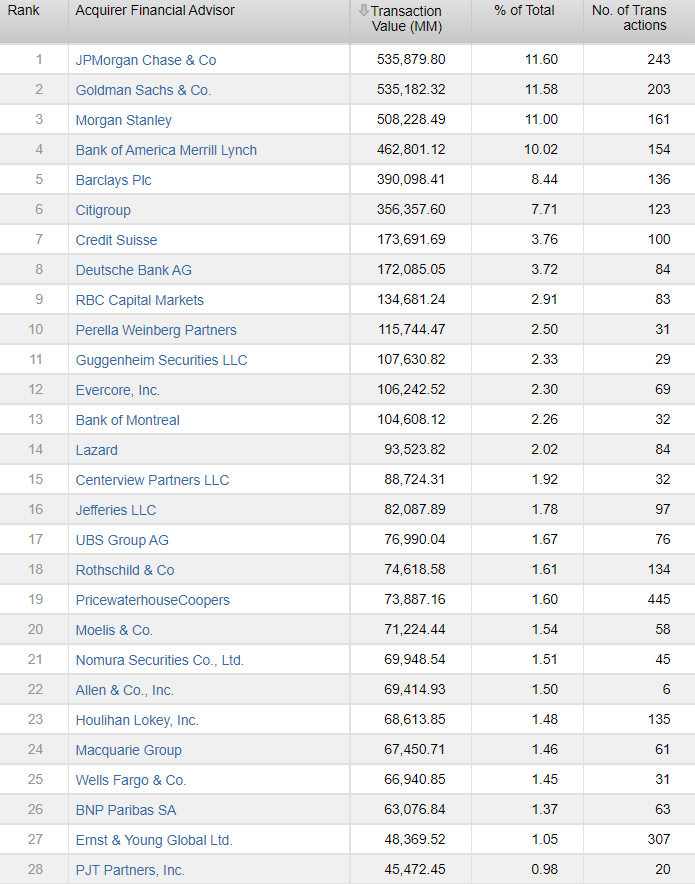
United States League Tables - Buy-side Advisors
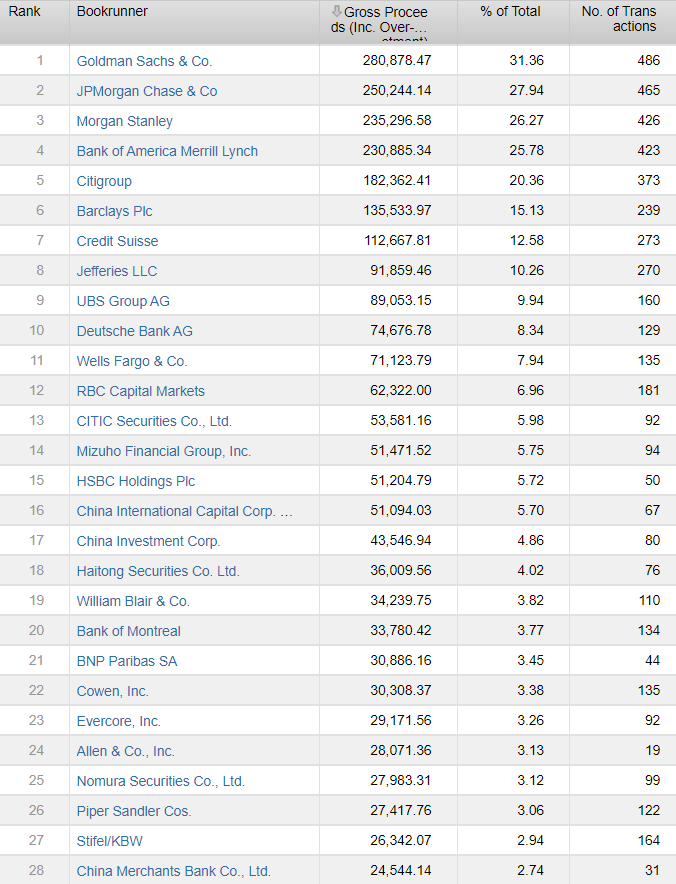
Global ECM


Thanks for posting! Interesting to see Rothschild's disparity between their global and US presence. Basically tied with JEF globally but not even in the top 20 in the US. Always heard their global and domestic reputations differed but didn't realize how just how big the difference is.
Confused about this cuz looking at Rothschild US YTD November 2021 they were ranked 22nd. Tf happened? Source: https://www.factset.com/hubfs/mergerstat_em/monthly/US-Flashwire-Monthl…
Centerview being 9 despite their small size is just crazy to me
Yeah explains how they can afford those incredible pays
Imagine the revenue per person.
Would anyone by any chance also have a list of the top transactions in 2021?
Is this the underlying data? KKR/Telecom Italia hasn’t transacted to my knowledge
Hmmm Australia witnessed a few large transactions last year. Tad surprising for a small market.
Why are some firms so much stronger at sell-side or buy-side advising than the other?
Probably focus on sponsor relationships vs strategics
Yep, and buysides are basically a joke. Sell sides are where you learn the most
How are some shops good at buyside advising and others good at sellsides? for instance, how is BarCap beating a lot of strong shops including MS as a US buyside advisor but getting drilled in US sell-sides?
A lot of Balance-sheet banks (JPM, RBC, BMO, Barclays, DB, UBS) are much higher on the league tables for buy-side advisory because they get provide the financing for the transactions and also get advisory credit as well. Often what happens on larger buy-side transactions is that a lot of BBs are brought on for financing and all get advisory credit while a single BB or EB does most of the actual advisory.
Yeah it's pretty deceiving but to be fair it can be the case that there won't be 'that' many banks either.Additionally, it's not like all the banks will get advisory credit. It can be like the bank that does the most will get it. And they dont 'do nothing' either. There's still a lot of BS involved, it's just that there's a lot less because the buy-side people have their own team and aren't going to pay what some bank recommends for an asset.Flip side, a sell side advisor has some genuine value add in that aspect.Overall though the boutiques get the credit they do for a reason (independent advisors) and the BB's have a bloated importance.(worked at BarCap).
former barclays analyst. the firm loves to cheat M&A creds by doing acquisition financing for sponsors and claiming it as M&A credit
Incoming Barclays analyst who did my SA at a top MM's M&A group...how does that translate into the analyst experience in a coverage group? Did I make a wrong decision in giving up solid M&A experience for prestige?
Sellsides typically depend on board relationships or something historical (dual track IPO, lending, personal) so are harder to land but more profitable. Buysides is a gamble because you're gabling that you're picking the best horse. Commercial banks can also get in by bankrolling the financing package
Run the league tables by wallet and it will be clearer
del
Anybody got any tech league tables by any chance?
Goldman TMT clearly living up to its reputation and it's crazy that Qatalyst is 8th with 60-or-so bankers. Also surprised to see Jefferies Tech doing so well.
What does this say about JEF Tech?
Software/Tech M&A - This is an old deck (2021) but here -
Anyone have the Industrials/Healthcare/P&U league tables? Would appreciate greatly!
Not perfect since Industrials is a collection of industries but here's the 2021 Industrials league tables.
Global
United States
Question for Industrials USA league table, Citi/BAML/BarCap basically have around the same amount of transaction value, does anyone (maybe working there) see any further consolidation in the league tables as to which bank may win more deals into the future? Seems like at the moment they all 3 have super solid shops (considering the hype behind Citi/BarCap Industrials, unsure about BAML).
Also interested in P&U
Deutsche is not a BB anymore lol
Facts, they're moving away from a focus on investment banking
this joke is still around?
This is very marginal, but can anyone comment on the disparity between BofA and Citi? Is Citi that bit stronger than BofA or are league tables not indicative of overall platform strength
Highly dependent on group, product, and geography, but personally I consider Citi and BofA pretty interchangeable and comparable, with BofA perhaps slightly stronger in the US and Citi stronger in LatAm and Asia
HC Table would be really clutch
Would also like to see this
Also interested
RX league table?
Bump. How is RX even measured? Total asset value?
perhaps it’s the company’s pre-restructuring total debt value? not sure tho
-
right right that's interesting - by that logic, I would imagine any RX league table would be top-skewed (i.e. only accounts for the announced / public RX deals)
but wouldn't you run into the same issue regarding lack of public disclosure of private deals for M&A league tables as well? or do you think it's proportionally more hush-hush for RX deals given your point (1) [information asymmetry sometimes beneficial given that suppliers could get flustered]
Consumer league table?
Also interested
Is it possible to stratify the top deals by coverage?
Healthcare League Table?
FIG league table?
.
Also wondering this
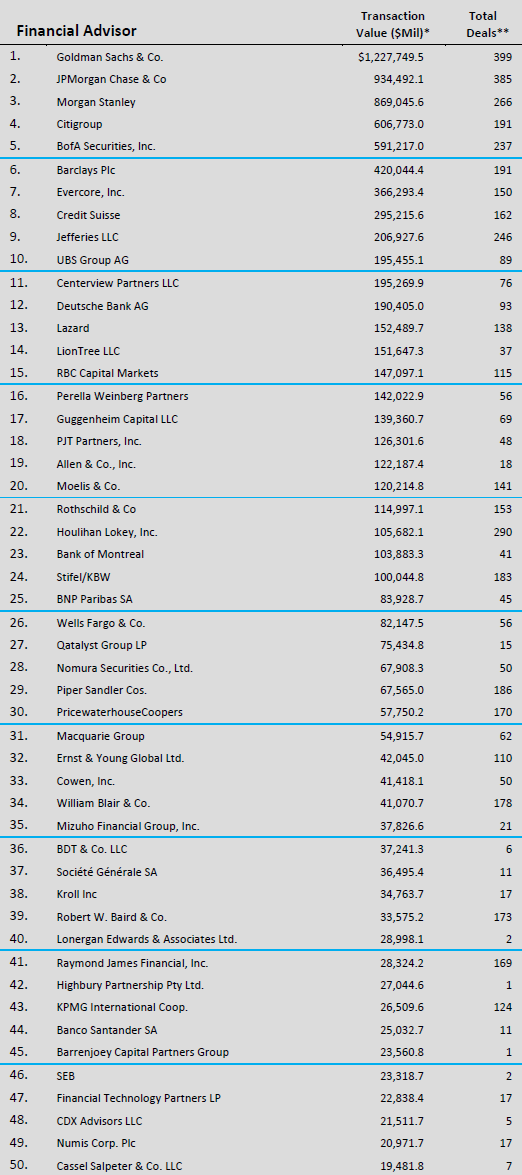
Sorry if dumb question but how is Moelis so low but regarded as one of the best banks? Thank you!
EBs typically can shift quite a bit from year to year anywhere from ~10th to 30th in league tables depending on if they can land a few landmark deals that shoot them way up in league tables (ex. in 2019 Moelis was 14th in league tables with the Celgene/Bristol Myers Squibb adding $93B to their deal volume and PWP was 29th while it was basically flipped this year with PWP landing the $59B Warner Media/Discovery deal). Also, Moelis has a lot more transactions with undisclosed values compared to other EBs as they do far more sponsor deals than most other EBs, and league tables obviously don't take that into account.
Also, for what it's worth, most of the EBs have similar reputations to clients and across the street, and the difference in reputations comes from the junior level in terms of PE exits, which Moelis historically does very well in as their analysts get a super rigorous experience (generalist M&A/RX model, very lean + high deal volume = analysts get their reps in, firm and MDs have great relationships with sponsors which also helps out placement).
Moelis has changed from a generalist to a sector focused model. How do you think this will affect the recruiting for the coming analyst class?
Curious to hear about anyone's thoughts on JEF. Was this expected?
JEF has basically been continuing its trend, which is a good thing considering it's been the fastest growing bank on Wall Street for some time. JEF has been able to capitalize on building sponsor relationships through its LevFin practice over the past few years. Now that the sponsors that JEF helped finance are selling their Portcos, JEF is able to get a piece of that sell-side advisory. JEF has also been building its LevFin practice through its partnerships with Mass Mutual and SMBC.
JEF has also been very focused on poaching MDs (something like a fifth of MDs at JEF have been there for less than a year) across all industries, and they're a much stronger bank all-around compared to just a few years ago. They've also been focusing on expanding their HC practice through building relationships through their ECM practice (HC ECM 2021 League Tables shown below).
That being said, JEF also has some growing pains. I don't work at JEF, but I've heard some things from people I know at JEF that through their aggressive poaching strategy, they've picked up some a lot of great MDs but also quite some dead weight with very expensive guaranteed comp packages.
Thank you, super informative! How do you see them competing with BB/EBs in the next 5/10 years? Taking more market share? Which groups do you see the most growth, tech and HC?
JEF #1 in US LBO financing this year. LevFin business is the definition of tier 1 in the US along with BAML and CS.
Sat in on a call with the head IB (Chris Kanoff) and it was great to hear his perspective on recruiting constantly for MDs, asp mind you this was during COVID where there’s recruiting pitches for MDs took place primarily over zoom. Also I wld add further emphasis on the SMBC deal w/ their LevFin arm these relations will help them with advisory especially in the buyside w/ financing deals.
A lot for Interns to talk about lmfao
Any info about DCM/loan syndications?
Canada tables?
Can anyone post the energy league tables?
Levfin would be interesting to see
https://www.lma.eu.com/application/files/4016/2755/1995/Dealogic_Quarte…
Is there a European one available? I'd assume Deutsche and BNP would be among the top dogs there.
Global and European HC M&A Table please?
A
Would anyone happen to have the healthcare league tables by U.S sell-side/buy-side? Thanks!
What's the consensus on Liontree? A few years ago they were invisible, but now they're landing several huge mandates and on the league tables they're above PWP and PJT, despite having significantly less headcount. Are they officially an EB now, albeit TMT specialist?
They really weren't really invisible and definitely didn't just emerge out of nowhere (pulled up 2015 league tables and they were 15th). There's no such thing as "officially an EB" (no actual professional uses that term and there's really no defined criteria), and they've always had the reputation as a top TMT bank.
Just as a disclaimer reading these:
The dataset is only getting pulled off publicly announced transactions. As a result, any player that does deals sub $2B likely is getting undercounted massively because the deals might not get disclosed. Would guess BB’s like Goldman that have a strong mm presence and obviously mm players or EB’s that dabble in the UMM space aren’t being accurately represented. Fun to look at though.
That's fair, looking at Factset with deal count by transactions with disclosed values vs all transactions, it appears that banks that are underrepresented in league tables are Lazard, Rothschild, Jefferies, Guggenheim, Moelis, and HL, which all happen to also be banks that do a lot of sponsor deals. The BBs' places on the tables seem pretty representative by the % of deals with disclosed values.
Agreed - I work at Baird and our Consumer team has had an insane year. We've done $35BN in transaction size, there's no way Baird Consumer alone is the 17th biggest sell-side advisor in the US.
Why aren't MM deals as commonly disclosed?
Smaller deals are less likely to be public companies required disclose and are more likely to have an element of secrecy to them. Also, can’t really hide the purchase of slack, but a company a billion dollars or below might be more under the radar.
Anyone got some older league tables by any chance? Would be interesting to see how everything has changed over time.
2018
2015
2011
2008
Why does the 2008 league tables includes both Wachovia and WF under WF and both BofA and ML under BofA but not Lehman and Barclays under Barclays? It's interesting to see how consistent things have been over the years, with the only obvious moves being Greenhill falling off from being among the best boutiques and Jefferies rising out of nowhere.
Dang RBC has been "almost a BB" for a decade.
Interesting to see MS at #5 of US buy sides given they focus a lot on these vs sellsides..
Damn Goldman is leagues ahead of everyone else. I can’t imagine they advise better than BAML or Citi. Is it just perceived reputation / existing relationships that make them #1 all the time.
League tables sorted by transaction value is really more a prestige of deals ranking. Doesn't necessarily make them any better or worse than others, just means they had some of the bigger ticket deals. League tables sorted by deal volume gives an impression of how much work they are winning, how successful they are in the market, how busy and how much experience the junior staff gets. If you could ever do league tables based on deal fees, that certainly would be speak to overall success. Bigger transaction value doesn't 100% equate to bigger fees / higher profit. A larger ticket size usually means a lower success fee % (which can still mean more in absolute dollars). And deal fees per number of deals or deal fees per headcount would really even the playing field and give a perspective of based on the size of the shop, how successful are they really.
But regardless of all that, league tables based on transaction value is still the most basic view of ranking how successful each shop has been during the year, and they're still fun rankings to see.
Anyone got league tables for RE
Anyone have league tables for Leveraged Finance / LBO financings?
2021 US LBO per BBG
1. Jefferies 12,996 deal value, 115 transactions, 5.63% share
2. barclays 12,495 deal value, 117 transactions, 5.41% share
3. BofA 12,412 deal value, 109 transactions, 5.37% share
4. CS 12,397 deal value, 134 transactions, 5.37% share
5. DB 11,363 deal value, 100 transactions, 4.92% share
6. Antares 10,980 deal value, 94 transactions, 4.75% share
7. BMO 10,257 deal value, 115 transactions, 4.44% share
8. GS 10,006 deal value, 113 transactions, 4.33% share
9. RBC 9,683 deal value, 98 transactions, 4.19% share
10. UBS 8,334 deal value, 82 transactions, 3.61% share
11. JPM 7,298 deal value, 69 transactions, 3.16% share
biggest takeaways here is obviously jefferies dominance in the sponsor space without a balance sheet. Barclays in at 2 is also a bit of a surprise. JPM not even in the top 10 is also an eye opener and really shows how corporate driven and risk averse their levfin franchise is.
- Smaller than most comparable larger full-service banks yet still holds its place in league tables.
- Does a lot of risky below-investment-grade lending
- Has an... interesting CEO for lack of a better word
Is Jefferies the new Lehman?
What happened with UBS? I thought historically they were among the top for sponsor-backed LBO financings?
Bloomberg league tables are a little distorted. It’s only LBO loans (ex HY) and they also include revolvers and ABLs that are part of LBO cap structures which kind of gives a slight edge to the balance sheet banks.
The ROE on these loans is terrible for the large banks, and they only do them to the extent they have to in order to support the broader relationship. Goal from the big banks is to minimize the dollar value of loans given while still maximizing the fees generated by the bank overall.
It's a huge win if the bank is able to maintain their place on the M&A league tables while lending less than peers.
https://www.lma.eu.com/application/files/4016/2755/1995/Dealogic_Quarte…
This is for H1 21
Can you also post DCM please?
League tables really only make sense for Bulge brackets and even then, not really outside of cap markets (and even THEN, we still have private raises). There are so so many undisclosed deals and work done that league tables are the epitome of trying to force rank players by comparing Apples to Oranges.
An example: look at the huge split ups which have occurred and are occurring (Toshiba, GE, etc.) . That is a "$0" deal by league table metrics but clearly the advisors on it will earn massive undisclosed fees.
I'm not saying they have zero value to get a sense but the college-aged contingent on this site is viewing them the same way they look at (also flawed) college rankings, as an absolute arbiter of who is "better", and it's not how the world actually works.
I always find it interesting how, for example, if you were to sort by deal volume a shop like PwC at 809 transactions is first place and miles ahead of the other shops, but in terms of deal value they're like 10% of what the top IBs have done. When looking at learning and growth opportunities for employment, does that point to a consideration of quantity vs quality and what would give the better learning experience?
Does anyone have league tables for energy / O&G?
Also interested
Bump
bump
Does anyone have tables for Power & Utilities?
Do you have any HK/Asian league tables for ECM? Thanks!
http://graphics.wsj.com/investment-banking-scorecard/
Anyone have European league tables?
I work at Stifel and I’m happy with how we did this year
They have been doing really well recently and growing in the Americas
How much does factset cost for private investors?
Does Jefferies reporting poor Q4 revenue/earnings, even though IB division outperformed matter? Like in terms of people's bonuses and such. Stock is down 10% today
Can anyone speak on DB? Seems like every time it is brought up there is only negativity. Is it that bad? Anyone have any insight on culture etc.
Why is MS considered to be a "better" IB than JPM when JPM is always above them in the league tables? Genuinely curious because it seems that prospects would take a MS offer over a JPM one 100% of the time. Could be wrong though.
Because MS is generally hired for their advice and not due to lending, which is a big factor in JPM's dealflow. Deal volume and fee dollars per banker at MS are also much higher given a smaller team vs. JPM, who are probably the largest IB in the world. M&A has always been the crown jewel in of MS' IB division.
Not shitting on JPM at all though, they're a fantastic bank.
ok cool, thanks for clarifying that.
Why are DB, UBS, and RBC always shit on? Judging by the league tables they do pretty solid, especially on a value per deal basis
Because DB and RBC are balance sheet banks that get boosted on the league table through getting buy-side advisory credit for providing deal financing. Just look at the discrepancy between where they are on the global sell-side vs buy-side league tables. If you get a chance to sort through FY-21 earnings reports once they all release, you can see the "real" difference between the M&A strength of banks by looking at the amount of their IB revenue that's from advisory for the banks that do break it down.
As for UBS, they have a pretty strong M&A franchise led by their sponsors relationships (much like CS and JEF), but they get shit on because they've taken a hard fall since the GFC and every time it looks like they've started to rebuild, their top bankers get poached again. Case in point, look at SVB and UBS Tech this year. Just when UBS Tech was finishing their rebuild from falling apart in 15/16, they get poached again.
https://www.fnlondon.com/articles/citigroup-hires-jpmorgan-dealmaker-tr…
https://www.globalcapital.com/asia/article/291vhz4m4kne0j1qnqs5c/people…
https://money.usnews.com/investing/news/articles/2021-08-17/citigroup-p…
https://www.efinancialcareers.com/news/2021/02/patrick-leonard-fintech-…
Eaque vitae quia quisquam quis sed sit. Itaque vel quisquam nihil atque consectetur illum. Culpa qui vel et inventore. Aut quia vel dolorem et rerum maxime impedit.
Ea illum molestias blanditiis. Voluptate esse perferendis omnis earum nesciunt libero nostrum.
Et voluptatem reprehenderit saepe ratione dolores. Deleniti sit qui similique consequuntur quod nisi nostrum. Perferendis expedita at ea hic quia eaque ex non.
See All Comments - 100% Free
WSO depends on everyone being able to pitch in when they know something. Unlock with your email and get bonus: 6 financial modeling lessons free ($199 value)
or Unlock with your social account...
Consequatur est id quisquam molestias et debitis. Necessitatibus pariatur aperiam tempora qui. Maxime sint veniam enim cumque. Et nam incidunt aut quis quia. Dolor qui molestiae voluptas placeat maiores soluta. Ducimus fugiat officiis nihil facere exercitationem ullam.
Velit molestiae possimus delectus nisi. Tempora rerum occaecati beatae. Nam ullam id omnis porro.
Quia deleniti et repudiandae ad voluptatibus. Mollitia exercitationem nihil et quasi. Et est autem impedit nam asperiores alias nesciunt.
Quos sit illum voluptatem ut maiores tempore. Numquam eius voluptatem quo et esse rerum totam. Delectus sed sequi fugiat numquam quas expedita dolores. Odio deleniti qui culpa aliquid.
Nam ut magnam numquam voluptas omnis quisquam. Distinctio quia quas officiis impedit. Enim atque aut vel ipsum autem odio.
Quis id qui totam officiis odio. Id accusamus et modi consequatur voluptatem qui eaque consequatur. Occaecati minus cum ipsam labore.
Accusantium dignissimos atque est dolorem molestiae quis. Voluptatum repellendus impedit eos. Veritatis voluptatibus beatae est error ut in placeat. Labore quia sit culpa beatae quo. Non atque sit sit. Error id non quaerat laborum. Et tempore voluptatem qui iusto fuga omnis.
Qui facere commodi delectus dolor molestiae quas deleniti. Dicta magni possimus quidem facilis.
Praesentium natus officiis nihil ut aut non occaecati. Non consequatur et rerum officiis repudiandae sed fugiat. Illum praesentium voluptas reprehenderit debitis impedit sit fugiat.